pythonで散布図アニメーションを試してみた
最近pythonを触り始めたのですが、散布図をアニメーションさせる方法が分からなかったので調べてみました。
散布図はmatplotlib.plt.scatter(x,y)で作成する事が出来ます。
また、アニメーションをさせる方法は二通りのやり方があるようです。
- animation.ArtistAnimation
- 事前に用意してあるデータを描画
- animation.FuncAnimation
- 随時データを更新する
そこで円周上の点を一度ずつ移動させるというアニメーションをArtistAnimationとFuncAnimationの2つの方法で試してみました。 実行結果はどちらも次のようなものになります。

animation.ArtistAnimationの場合
事前にplt.scatterの戻り値をlistに保存しておき、animation.ArtistAnimationの第二引数に渡すと 描画する事が出来ました。
# -*- coding: UTF-8 -*-
import math
import matplotlib.pyplot as plt
import matplotlib.animation as animation

fig = plt.figure()

# 360度分のデータを作成
ims = []
for i in range(360):
    rad = math.radians(i)
    im = plt.scatter(math.cos(rad), math.sin(rad))
    ims.append([im])

# アニメーション作成
ani = animation.ArtistAnimation(fig, ims, interval=1, repeat_delay=1000)

# 表示
plt.show()
animation.FuncAnimationの場合
更新のためのコールバック関数をanimation.FuncAnimationの第二引数に入れます。
また、コールバック関数の引数はfargs=(fig, im)のようにして渡す事が出来ます。
# -*- coding: UTF-8 -*-
import math
import matplotlib.pyplot as plt
import matplotlib.animation as animation

# 更新する内容
def _update_plot(i, fig, im):
    rad = math.radians(i)

    # 前回のフレーム内容を一旦削除
    if len(im) > 0:
        im[0].remove()
        im.pop()

    im.append(plt.scatter(math.cos(rad), math.sin(rad)))

fig =  plt.figure()

# グラフを中央に表示
ax = fig.add_subplot(1,1,1)

# グラフの目盛範囲設定
ax.set_xlim([-1.5, 1.5])
ax.set_ylim([-1.5, 1.5])

im = [] # フレーム更新の際に前回のプロットを削除するために用意

# アニメーション作成
ani = animation.FuncAnimation(fig, _update_plot, fargs = (fig, im),
        frames = 360, interval = 1)

# 表示
plt.show()
前フレームで描画された点を消しながらアニメーションさせる方法が分からず悩みましたが、plt.scatterの戻り値をremoveする事で解決出来ました。(本当はもっと良いやり方があるのかもしれません。)
おまけ
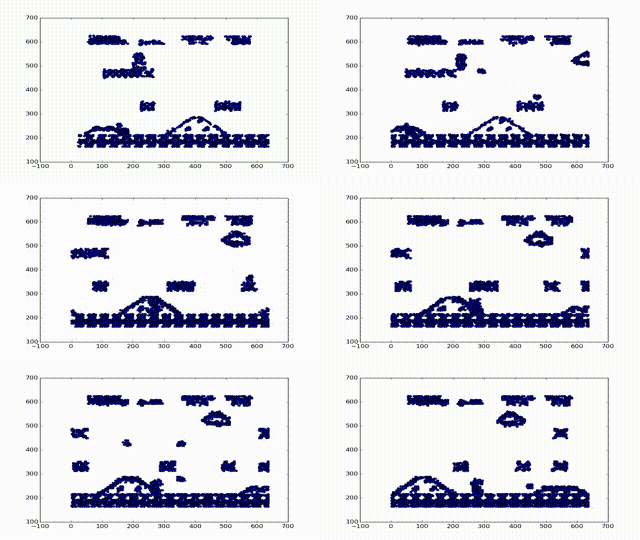
せっかくなので、某ゲームのプレイ動画からフレームを切り出して特徴量抽出したものをanimation.ArtistAnimationで表示してみました。
動画からフレームの切り出しはffmpegが便利です。
Macの場合は
brew install ffmpeg --with-libvorbis --with-libvpx --with-schroedinger
でffmpegを導入した後、
ffmpeg -i input.mpeg -f image2 frame%d.jpg
とする事でフレームの切り出しが出来ます。
また特徴量抽出にはopencvを使いました。詳しくはopencv, pythonで検索してみてください。
#coding: UTF-8
import cv2
from matplotlib import pyplot as plt
import matplotlib.animation as animation

fig = plt.figure()
ims = []
for i in range(1, 100):
    name = "frame" + str(i) + ".jpg"
    img = cv2.imread(name,0)
    width, height = img.shape

    # 検出器の初期化
    orb = cv2.FastFeatureDetector()

    # 特徴量の検出と出力用の計算
    kp = orb.detect(img, None)
    x = []
    y = []
    for p in kp:
        x.append(p.pt[0])
        y.append(height - p.pt[1]) # opencvの座標系は左上原点なので調整

    im = plt.scatter(x, y)
    ims.append([im])

# 動画保存の準備
Writer = animation.writers['ffmpeg']
writer = Writer(fps=15, metadata=dict(artist='Me'), bitrate=1800)

ani = animation.ArtistAnimation(fig, ims, interval=50, repeat_delay=1000)

#動画として保存
ani.save('im.mp4', writer=writer)

plt.show()
実行結果はこんな感じになります。

たったこれだけの行数でここまで出来るのは嬉しいですね。 さすがpython!

