J-segment: Difference between revisions
Less reflective, distraction and noise as well as improved angle |
|||
| Line 1,376: | Line 1,376: | ||
File:2017 Mazda CX-5 (KF) Maxx 2WD wagon (2018-11-02) 01.jpg|[[Mazda CX-5]] (2013–present) |
File:2017 Mazda CX-5 (KF) Maxx 2WD wagon (2018-11-02) 01.jpg|[[Mazda CX-5]] (2013–present) |
||
2018 Mercedes-Benz GLC 250 Urban Edition 4MATIC 2.0 Front.jpg|[[Mercedes-Benz GLC-Class]] (2015–present) |
2018 Mercedes-Benz GLC 250 Urban Edition 4MATIC 2.0 Front.jpg|[[Mercedes-Benz GLC-Class]] (2015–present) |
||
File: |
File:2017 Mitsubishi Outlander (ZK MY17) LS 2WD wagon (2018-08-27) 01.jpg|[[Mitsubishi_Outlander#Third_generation_.282012.E2.80.93present.29|Mitsubishi Outlander]] (2001–present) |
||
File:2018 Mitsubishi Eclipse Cross 3 4X2 1.5 Front.jpg|[[Mitsubishi Eclipse Cross]] (2017-present) |
File:2018 Mitsubishi Eclipse Cross 3 4X2 1.5 Front.jpg|[[Mitsubishi Eclipse Cross]] (2017-present) |
||
Peugeot 3008 THP 165 EAT6 Allure GT-Line (II) – Frontansicht (2), 20. September 2017, Düsseldorf.jpg|[[Peugeot_3008#Second_generation_.282016.E2.80.93present.29|Peugeot 3008]] (2008–present) |
Peugeot 3008 THP 165 EAT6 Allure GT-Line (II) – Frontansicht (2), 20. September 2017, Düsseldorf.jpg|[[Peugeot_3008#Second_generation_.282016.E2.80.93present.29|Peugeot 3008]] (2008–present) |
||
Revision as of 08:54, 30 December 2018
J-segment is a car classification defined by European Commission as the segment of the sport utility cars (including off-road vehicles).[1] It is increasing in volume year by year in Europe; in early 2015, it became the most popular segment with 28% market share.
These cars come in a huge variety of sizes. As SUVs have developed in body style over the years, crossovers are also starting to emerge, a common combination being a hatchback and SUV. They have also gained popularity over the years with celebrities, encouraging large luxury vehicles with an emphasis on comfort, space and a high-ride position. Off-road vehicles also fit into this segment.
Typical J-segment vehicles include the BMW X5, Land Rover Discovery, Mercedes-Benz M-Class, Porsche Cayenne, Range Rover Sport, Volkswagen Touareg, Volvo XC90.
European sales figures
Standard
Small & subcompact SUVs and crossovers – A-Suv & B-Suv
| 2017 rank |
Manufacturer | Model | 2013 sales | 2014 sales | 2015 sales | 2016 sales | 2017 sales | % change (2016–2017) |
|---|---|---|---|---|---|---|---|---|
| 1 | Renault | Captur | 84,085 | 164,801 | 194,847 | 215,493 | 211,321 | |
| 2 | Peugeot | 2008 | 58,672 | 135,541 | 154,325 | 175,079 | 179,529 | |
| 3 | Opel/Vauxhall | Mokka | 70,768 | 127,437 | 163,246 | 164,340 | 169,886 | |
| 4 | Dacia | Duster | 88,082 | 127,772 | 125,416 | 139,826 | 145,682 | |
| 5 | Nissan | Juke | 106,411 | 97,538 | 102,574 | 98,108 | 91,774 | |
| 6 | Fiat | 500X | — | 135 | 74,262 | 104,931 | 90,049 | |
| 7 | Jeep | Renegade | — | 7,768 | 53,940 | 76,203 | 72,578 | |
| 8 | Suzuki | Vitara | — | — | 43,247 | 73,099 | 72,301 | |
| 9 | Ford | EcoSport | — | 12,890 | 40,084 | 57,294 | 63,150 | |
| 10 | Citroën | C4 Cactus | — | 28,974 | 78,888 | 71,378 | 56,245 | |
| 11 | Mazda | CX-3 | — | — | 24,232 | 52,409 | 53,871 | |
| 12 | Škoda | Yeti | 57,588 | 63,419 | 64,348 | 59,531 | 45,430 | |
| 13 | Mitsubishi | ASX | 26,468 | 35,295 | 45,228 | 39,241 | 39,160 | |
| 14 | Opel/Vauxhall | Crossland X | — | — | — | — | 38,964 | |
| 15 | Kia | Niro | — | — | — | 8,562 | 33,972 | |
| 16 | Suzuki | S-Cross | 8,985 | 39,070 | 29,087 | 23,185 | 31,764 | |
| 17 | Honda | HR-V | — | — | 7,621 | 33,064 | 29,375 | |
| 18 | Citroën | C3 Aircross | — | — | — | — | 16,982 | |
| 19 | Suzuki | Jimny | 10,713 | 10,787 | 12,271 | 13,184 | 14,710 | |
| 20 | Kia | Soul | 3,202 | 10,261 | 16,326 | 13,599 | 12,437 | |
| 21 | Kia | Stonic | — | — | — | — | 9,954 | |
| 22 | SsangYong | Tivoli | — | — | 4,512 | 10,051 | 7,144 | |
| 23 | Hyundai | Kona | — | — | — | — | 6,884 | |
| 24 | SEAT | Arona | — | — | — | — | 6,070 | |
| 25 | Volkswagen | T-Roc | — | — | — | — | 4,930 | |
| 26 | SsangYong | XLV | — | — | — | 1,154 | 2,216 | |
| 27 | Lada | Niva 4x4 | 1,670 | 1,542 | 1,652 | 1,915 | 1,997 | |
| 28 | Suzuki | SX4 | 28,106 | 14,126 | 3,161 | 489 | 393 | |
| 29 | Chevrolet | Trax | 17,658 | 9,316 | 229 | 71 | 7 | |
| 30 | Fiat | Sedici | 5,849 | 3,550 | 249 | 4 | 3 | |
| Total | — | — | — | — | — | 1,432,225 | 1,508,768 |
Compact SUVs and crossovers – C-Suv
| 2017 rank |
Manufacturer | Model | 2013 sales | 2014 sales | 2015 sales | 2016 sales | 2017 sales | % change (2016–2017) |
|---|---|---|---|---|---|---|---|---|
| 1 | Nissan | Qashqai | 201,722 | 202,914 | 230,661 | 233,496 | 247,199 | |
| 2 | Volkswagen | Tiguan | 142,523 | 150,641 | 148,338 | 178,333 | 236,323 | |
| 3 | Peugeot | 3008 | 81,398 | 78,215 | 67,079 | 75,032 | 168,356 | |
| 4 | Hyundai | Tucson | — | — | 36,094 | 147,072 | 152,103 | |
| 5 | Ford | Kuga | 64,767 | 86,445 | 102,464 | 119,433 | 151,451 | |
| 6 | Kia | Sportage | 90,342 | 96,556 | 104,984 | 138,218 | 129,595 | |
| 7 | Renault | Kadjar | — | — | 49,520 | 130,090 | 111,705 | |
| 8 | Toyota | C-HR | — | — | — | 7,123 | 108,170 | |
| 9 | SEAT | Ateca | — | — | — | 22,928 | 74,692 | |
| 10 | Mazda | CX-5 | 49,883 | 57,289 | 56,179 | 55,345 | 59,499 | |
| 11 | Jeep | Compass | 6,572 | 4,829 | 616 | 457 | 15,591 | |
| 12 | Subaru | XV | 12,216 | 10,745 | 8,925 | 10,400 | 10,618 | |
| 13 | Opel/Vauxhall | Grandland X | — | — | — | — | 8,971 | |
| 14 | Škoda | Karoq | — | — | — | — | 5,891 | |
| 15 | Citroën | C4 Aircross | 11,822 | 12,142 | 11,771 | 9,217 | 4,901 | |
| 16 | Jeep | Wrangler | 5,619 | 5,302 | 6,059 | 4,259 | 3,670 | |
| 17 | SsangYong | Korando | 3,232 | 4,820 | 5,795 | 3,874 | 3,327 | |
| 18 | MG | GS | — | — | — | 583 | 974 | |
| 19 | Peugeot | 4008 | 3,972 | 2,533 | 2,442 | 2,036 | 793 | |
| 20 | Hyundai | ix35 | 88,831 | 93,540 | 84,264 | 11,041 | 772 | |
| 21 | Mitsubishi | Eclipse Cross | — | — | — | — | 674 | |
| 22 | Opel/Vauxhall | Antara | 15,380 | 8,461 | 6,746 | 2,058 | 552 | |
| 23 | DR | DR5 | 199 | 106 | 165 | 186 | 241 | |
| 24 | Chevrolet | Captiva | 13,216 | 2,928 | 59 | 12 | 1 | |
| Total | — | — | — | — | — | 1,152,779 | 1,493,277 |
Mid-size SUVs and crossovers – D-Suv
| 2017 rank |
Manufacturer | Model | 2013 sales | 2014 sales | 2015 sales | 2016 sales | 2017 sales | % change (2016–2017) |
|---|---|---|---|---|---|---|---|---|
| 1 | Toyota | RAV4 | 47,534 | 54,187 | 51,838 | 69,919 | 71,047 | |
| 2 | Nissan | X-Trail | 5,811 | 16,178 | 40,243 | 60,444 | 69,833 | |
| 3 | Škoda | Kodiaq | — | — | — | 671 | 53,967 | |
| 4 | Peugeot | 5008 II | — | — | — | 28,034 | 46,689 | |
| 5 | Mitsubishi | Outlander | 25,960 | 33,744 | 46,581 | 40,578 | 36,281 | |
| 6 | Honda | CR-V | 47,596 | 49,182 | 46,967 | 43,456 | 34,616 | |
| 7 | Renault | Koleos | 8,404 | 7,418 | 4,675 | 186 | 13,232 | |
| 8 | Subaru | Forester | 14,579 | 13,889 | 14,428 | 12,607 | 13,185 | |
| 9 | Jeep | Cherokee | 421 | 8,629 | 12,442 | 9,740 | 5,531 | |
| 10 | Volkswagen | Tiguan Allspace | — | — | — | — | 2,792 | |
| 11 | Fiat | Freemont | 18,825 | 17,389 | 13,821 | 3,034 | 2 | |
| Total | — | — | — | — | — | 240,635 | 347,175 |
Full-size SUVs and crossovers – E-Suv
| 2017 rank |
Manufacturer | Model | 2013 sales | 2014 sales | 2015 sales | 2016 sales | 2017 sales | % change (2016–2017) |
|---|---|---|---|---|---|---|---|---|
| 1 | Ford | Edge | — | — | — | 6,200 | 16,000 | |
| 2 | Kia | Sorento | 7,610 | 9,390 | 16,539 | 15,344 | 12,570 | |
| 3 | Hyundai | Santa Fe | 10,588 | 13,390 | 14,492 | 15,937 | 11,728 | |
| 4 | Toyota | Land Cruiser | 5,444 | 6,258 | 6,052 | 6,286 | 5,237 | |
| 5 | Mitsubishi | Pajero/Montero/Shogun | 3,444 | 4,859 | 5,920 | 5,590 | 4,417 | |
| 6 | SsangYong | Rexton | 1,175 | 1,929 | 2,214 | 2,187 | 2,610 | |
| 7 | Mazda | CX-9 | — | 70 | 1,057 | 153 | 23 | |
| Total | — | — | — | — | — | 54,783 | 52,669 |
Premium
Small & subcompact SUVs and crossovers – A-Suv & B-Suv
| 2017 rank |
Manufacturer | Model | 2013 sales | 2014 sales | 2015 sales | 2016 sales | 2017 sales | % change (2016–2017) |
|---|---|---|---|---|---|---|---|---|
| 1 | BMW | X1 | 64,313 | 61,797 | 42,107 | 95,380 | 118,051 | |
| 2 | Audi | Q2 | — | — | — | 7,439 | 81,426 | |
| 3 | Audi | Q3 | 73,265 | 76,221 | 81,827 | 92,107 | 76,566 | |
| 4 | Mercedes-Benz | GLA-Class | 225 | 44,710 | 63,425 | 67,070 | 72,869 | |
| 5 | Land Rover | Range Rover Evoque | 51,861 | 50,838 | 51,626 | 63,950 | 56,834 | |
| 6 | Mini | Countryman / Paceman | 58,843 | 60,922 | 44,475 | 37,094 | 46,273 | |
| 7 | Infiniti | QX30 | — | — | — | 633 | 1,797 | |
| 8 | DS | DS 7 Crossback | — | — | — | — | 537 | |
| 9 | Jaguar | E-Pace | — | — | — | — | 507 | |
| 10 | BMW | X2 | — | — | — | — | 245 | |
| 11 | Volvo | XC40 | — | — | — | — | 117 | |
| Total | — | — | — | — | — | 363,673 | 455,222 |
Compact SUVs and crossovers – C-Suv
| 2017 rank |
Manufacturer | Model | 2013 sales | 2014 sales | 2015 sales | 2016 sales | 2017 sales | % change (2016–2017) |
|---|---|---|---|---|---|---|---|---|
| 1 | Mercedes-Benz | GLC-Class | — | — | 17,708 | 70,349 | 111,193 | |
| 2 | Volvo | XC60 | 46,185 | 62,845 | 77,197 | 82,990 | 99,023 | |
| 3 | Audi | Q5 / SQ5 | 56,327 | 60,679 | 64,235 | 70,266 | 70,388 | |
| 4 | Land Rover | Discovery Sport | — | 106 | 32,089 | 47,569 | 44,181 | |
| 5 | BMW | X3 | 59,566 | 48,229 | 45,609 | 47,455 | 41,355 | |
| 6 | Jaguar | F-Pace | — | — | — | 20,140 | 30,920 | |
| 7 | Porsche | Macan | 134 | 14,569 | 23,317 | 24,904 | 26,555 | |
| 8 | BMW | X4 | — | 10,845 | 23,380 | 24,840 | 21,881 | |
| 9 | Lexus | NX | — | 5,015 | 16,488 | 17,431 | 19,583 | |
| 10 | Alfa Romeo | Stelvio | — | — | — | — | 17,159 | |
| 11 | Land Rover | Range Rover Velar | — | — | — | — | 10,202 | |
| 12 | Mercedes-Benz | GLK-Class | 29,587 | 23,195 | 13,816 | 433 | 33 | |
| 13 | Land Rover | Freelander | 21,224 | 16,983 | 346 | 29 | 2 | |
| 14 | Infiniti | QX50 | 137 | 155 | 197 | 99 | 1 | |
| Total | — | — | — | — | — | 406,505 | 492,476 |
Mid-size & full-size SUVs and crossovers – D-Suv & E-Suv
| 2017 rank |
Manufacturer | Model | 2013 sales | 2014 sales | 2015 sales | 2016 sales | 2017 sales | % change (2016–2017) |
|---|---|---|---|---|---|---|---|---|
| 1 | BMW | X5 | 16,643 | 38,229 | 38,230 | 37,097 | 34,641 | |
| 2 | Volvo | XC90 | 7,690 | 6,931 | 20,487 | 35,471 | 30,367 | |
| 3 | Audi | Q7 | 11,037 | 10,491 | 20,698 | 33,358 | 30,351 | |
| 4 | Mercedes-Benz | GLE-Class | — | — | 9,221 | 29,923 | 26,519 | |
| 5 | Land Rover | Range Rover Sport | 15,843 | 25,779 | 28,343 | 28,304 | 26,052 | |
| 6 | Land Rover | Discovery | 10,325 | 11,239 | 12,317 | 12,939 | 16,654 | |
| 7 | Volkswagen | Touareg | 17,098 | 18,079 | 22,385 | 17,310 | 13,967 | |
| 8 | Land Rover | Range Rover | 11,094 | 12,134 | 14,300 | 13,418 | 13,663 | |
| 9 | Porsche | Cayenne | 16,855 | 12,323 | 17,851 | 17,169 | 11,933 | |
| 10 | Tesla | Model X | — | — | — | 3,683 | 11,877 | |
| 11 | BMW | X6 | 8,597 | 4,936 | 14,158 | 12,596 | 10,492 | |
| 12 | Jeep | Grand Cherokee | 11,155 | 13,820 | 13,719 | 13,191 | 10,167 | |
| 13 | Mercedes-Benz | GLE-Class Coupé | — | — | 4,288 | 10,803 | 8,661 | |
| 14 | Lexus | RX | 5,707 | 4,452 | 3,248 | 8,654 | 7,661 | |
| 15 | Maserati | Levante | — | — | — | 2,443 | 5,733 | |
| 16 | Mercedes-Benz | G-Class | 2,632 | 2,406 | 2,936 | 4,646 | 5,457 | |
| 17 | Mercedes-Benz | GLS-Class | 4,829 | 4,187 | 3,753 | 5,361 | 4,537 | |
| 18 | Bentley | Bentayga | — | — | — | 988 | 1,547 | |
| 19 | Infiniti | QX70 | 1,319 | 1,077 | 1,502 | 1,292 | 502 | |
| 20 | Land Rover | Defender | 810 | 1,147 | 1,237 | 182 | 7 | |
| Total | — | — | — | — | — | 288,828 | 270,788 |
Small or A-Cuv / A-Suv
Segment is currently growing in Europe thanks to the introduction of new models from different competitors.
-
Suzuki Jimny (1970–present)
Subcompact or B-Cuv / B-Suv
Renault Captur leads the subcompact sales in Europe in 2017, followed by Dacia Duster and Peugeot 2008.

-
Acura CDX (2016–present)
-
Audi Q2 (2016–present)
-
BMW X1 (2009–present)
-
BMW X2 (2017–present)
-
Brilliance FRV Cross (2009–present)
-
Changan CS15 (2016–present)
-
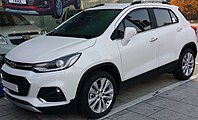
Chevrolet Trax (2012–present)
-
Daihatsu Terios (1997–present)
-
Fiat 500X (2014–present)
-
Ford EcoSport (2003–present)
-
Honda HR-V (2014–present)
-
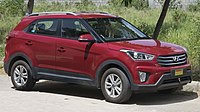
Hyundai Creta (2014–present)
-
Hyundai Kona (2017-present)
-
Jeep Renegade (2014–present)
-
Kia Soul (2009–present)
-
Kia KX3 (2015–present)
-
LADA 4x4 (1977–present)
-
Mazda CX-3 (2015–present)
-
Mitsubishi ASX (2010-present)
-
Mercedes-Benz GLA-Class (2013–present)
-
Mini Countryman (2010–present)
-
Peugeot 2008 (2013–present)
-
Suzuki S-Cross (2006–present)
-
Toyota C-HR (2016–present)
-
SsangYong Tivoli (2015–present)
-
Venucia R50X (2013–present)
Compact or C-Cuv / C-Suv
Best seller in the segment and best J-segment seller is Nissan Qashqai , followed by Volkswagen Tiguan and Ford Kuga.
This is the most popular subsegment in Europe.
Recent entries in the subsegment are Kia Niro, MG GS, Infiniti QX30 and Peugeot 3008.

-
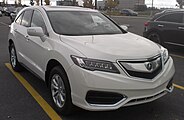
Acura RDX (2006–present)
-
Alfa Romeo Stelvio (2016–present)
-
Audi Q3 (2011–present)
-
BMW X3 (2003–present)
-
BMW X4 (G02) (2014–present)
-
Buick Envision (2014–present)
-
Changan CS35 (2014–present)
-
Chery Tiggo (2005–present)
-
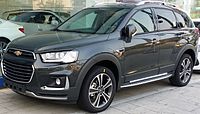
Chevrolet Captiva (2006–present)
-
Citroën C4 Cactus (2014–present)
-
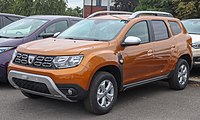
Dacia Duster (2009–present)
-
DS 6 (2014–present)
-
Ford Escape (2016–present)
-
Great Wall Haval H5 (2009–present)
-
Honda CR-V (1995–present)
-
Hyundai Tucson (2004–present)
-
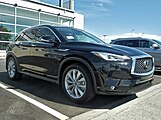
Infiniti QX50 (2013–present)
-
Jeep Compass (2006–present)
-
Jeep Wrangler (1986–present)
-
Kia Niro (2016–present)
-
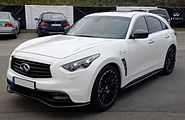
Kia Sportage (1993–present)
-
Land Rover Discovery Sport (2014–present)
-
Lexus NX (2014–present)
-
Lifan X60 (2011–present)
-
Mazda CX-5 (2013–present)
-
Mercedes-Benz GLC-Class (2015–present)
-
Mitsubishi Outlander (2001–present)
-
Mitsubishi Eclipse Cross (2017-present)
-
Peugeot 3008 (2008–present)
-
Range Rover Evoque (2011–present)
-
Renault Kadjar (2015–present)
-
SEAT Ateca (2016–present)
-
Škoda Karoq (2017–present)
-
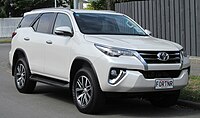
Toyota Fortuner (2005–present)
-
Toyota RAV4 (1994–present)
-
Trumpchi GS4 (2013–present)
-
Trumpchi GS5 (2012–present)
-
Venucia T70 (2015–present)
-
Volkswagen Tiguan (2007–present)
Mid-Size or D-Cuv / D-Suv

-
Acura MDX (2000–present)
-
Audi Q5 (2008–present)
-
BMW X6 (2007–present)
-
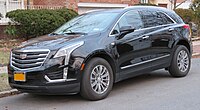
Cadillac XT5 (2016–present)
-
Changan CS75 (2015–present)
-
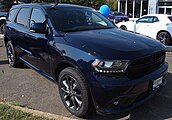
Dodge Durango (1997–present)
-
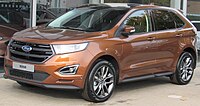
Ford Edge (2006–present)
-
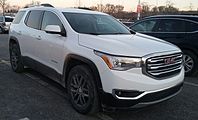
GMC Acadia (2006–present)
-
Hyundai Nexo (2018–present)
-
Hyundai Santa Fe (2000–present)
-
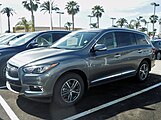
Infiniti QX60 (2012–present)
-
Infiniti QX70 (2003–present)
-
Jaguar F-Pace (2016–present)
-
Jeep Cherokee (1974–present)
-
Jeep Grand Cherokee (1992–present)
-
Kia Sorento (2002–present)
-
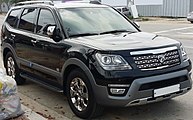
Kia Mohave (2008–present)
-
Land Rover Discovery (1989–present)
-
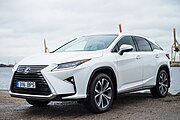
Lexus RX (1997–present)
-
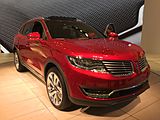
Lincoln MKX (2006–present)
-
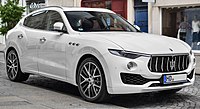
Maserati Levante (2016–present)
-
Mazda CX-9 (2006–present)
-
Mercedes-Benz GLE-Class (2015–present)
-
Mitsubishi Pajero (1982–present)
-
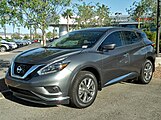
Nissan Murano (2002–present)
-
Nissan Pathfinder (1985–present)
-
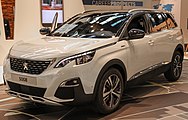
Peugeot 5008 (2009–present)
-
Porsche Macan (2014–present)
-
Range Rover Velar (2017–present)
-
Range Rover Sport (2005–present)
-
Renault Koleos (2007–present)
-
SsangYong Rexton (2001–present)
-
SEAT Tarraco (2019-present)
-
Subaru Forester (1997-present)
-
Škoda Kodiaq (2016–present)
-
Toyota Highlander (2000–present)
-
Toyota LC Prado (1984-present)
-
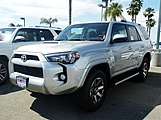
Toyota 4Runner (1984–present)
-
Volkswagen Touareg (2002–present)
-
Volvo XC60 (2008–present)
Full-Size or E-Cuv / E-Suv

-
Audi Q7 (2005–present)
-
Bentley Bentayga (2015–present)
-
Cadillac Escalade (1998–present)
-
Infiniti QX80 (2004–present)
-
Knight XV (2008–present)
-
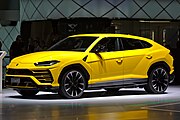
Lamborghini Urus (2018–present)
-
Lincoln MKT (2009–present)
-
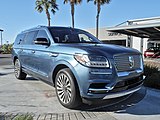
Lincoln Navigator (1997–present)
-
Mercedes-Benz G-Class (1979–present)
-
Mercedes-Benz GLS-Class (2006–present)
-
Nissan Patrol (1951–present)
-
Porsche Cayenne (2002–present)
-
Range Rover (1970–present)
-
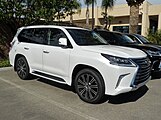
Lexus LX (1995-present)
-
Toyota Land Cruiser (1951-present)
-
Toyota Sequoia (2000–present)
-
Tesla Model X (2015–present)
-
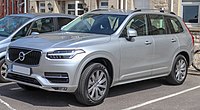
Volvo XC90 (2002–present)
See also
References
- ^ "REGULATION (EEC) No 4064/89 - MERGER PROCEDURE" (PDF). Office for Official Publications of the European Communities L-2985 Luxembourg.
- ^ "European sales 2017 small crossover segment - carsalesbase.com". 15 February 2018.
- ^ a b "European sales 2017 compact & midsized crossover segments - carsalesbase.com". 16 February 2018.
- ^ "European sales 2017 large SUV segment - carsalesbase.com". 16 February 2018.
- ^ a b "European sales 2017 Premium Midsized and Compact SUV segments - carsalesbase.com". 19 February 2018.
- ^ "European sales 2017 Premium Large SUV segment - carsalesbase.com". 19 February 2018.


