Save what you love
Hover over your favorite ideas to save them to your boards.


0:19
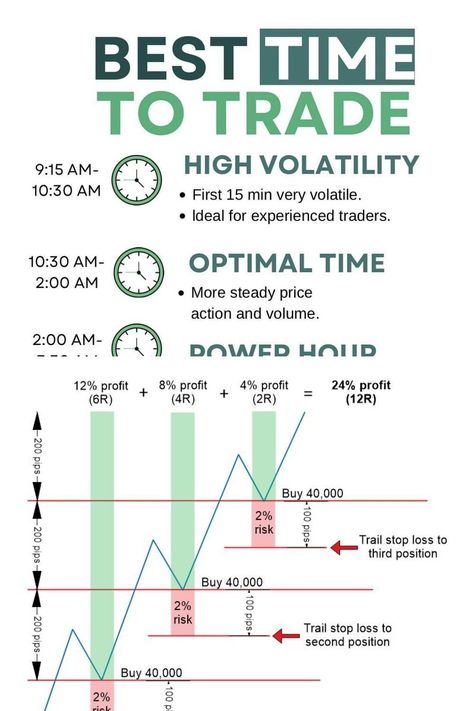
1 SETUP THAT FORMS EVERYDAY 🔥. Save it.
1 SETUP THAT FORMS EVERYDAY 🔥. Save it. 💡 Here's the Breakdown •Ensure you're within the ICT Killzones London or New York. •Inside the Killzone, on lower timeframe (1M,5M,15M) look for liquidity sweep into Higher timeframe Key level, that alligns with your Daily bias (Daily bias is Daily Timeframe market direction) •After the Liquidity Sweep, wait for Market Structure Shift (MSS) to the opposite side of price. •High probability breaker block usually has Fair Value Gap (FVG) in it. As price returns to the breaker, take your entry, with Stoploss slightly above the breaker or more extended, slightly above the FVG inside the Breaker. •Target sell side liquidity (SSL) or next draw on liquidity as take profit. •Timeframe to spot: 1M,5M,15M. #breakerblock #breakerblocks #ictstudent #ic


0:27
5 ICT SETUPS FOR LIFE
5 ICT SETUPS FOR LIFE 🔥. Save for later! Acronyms. HTF = Higher Timeframe Shift = Market Structure Shift POI = Point Of Interest FVG = Fair Value Gap OTE = Optimal Trade Entry IDM = Inducement For best results, look out for these setups within ICT Killzone time. Recommended Timeframe. 1M, 5M, 15M #forex #ict #smc #fvg #ote #idm #poi #marketstructureshift #reels

EXTERNAL LIQUIDITY
In simple terms, it describes liquidity that is available beyond the normal range of price movement or trading activity. This can be important for traders and investors, as it might indicate potential opportunities for large trades, significant price movements, or areas where liquidity could become thin (leading to more volatility).


JOIN OUR FREE TELEGRAM CHANNEL LINK IN BIO
Telegram channel for: Expert trading strategies, signals and analysis Real-time market updates and news Valuable resources and tutorials Exclusive community support https://t.me/Goldfx0fficial #forex #forextrading #forextradingstrategies #forexstrategies #forextrade #forexstrategy #forexcurrency #forexstrategie #forexcurrencies #trade #investment


We think you’ll love these