Technical analysis

34 Pins
·
10mo
an info sheet with different types of trading options and the words institution banks trading strategy link in
STRUCTURE & PATTERN
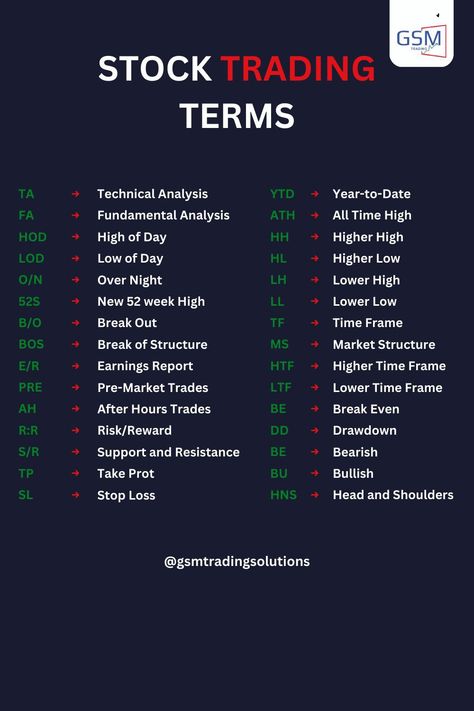
Chart patterns are specific formations or patterns that appear on financial charts, typically in the context of technical analysis. Traders and analysts study these patterns to identify potential trends and make informed trading decisions. .
a chart showing the timeframes for forex trading and how to use them
Support and Resistance levels on multiple time frames can be used for different purposes
the strength of a support chart is shown in red, green and blue with arrows pointing upward
an info sheet describing the differences between financial and technical analyses
Fundamental Analysis Vs Technical Analysis
the instructions for how to use candles mood lighting, candle lights, light up, warning signs, sign language, symbols, texts, feelings, sayings, texting
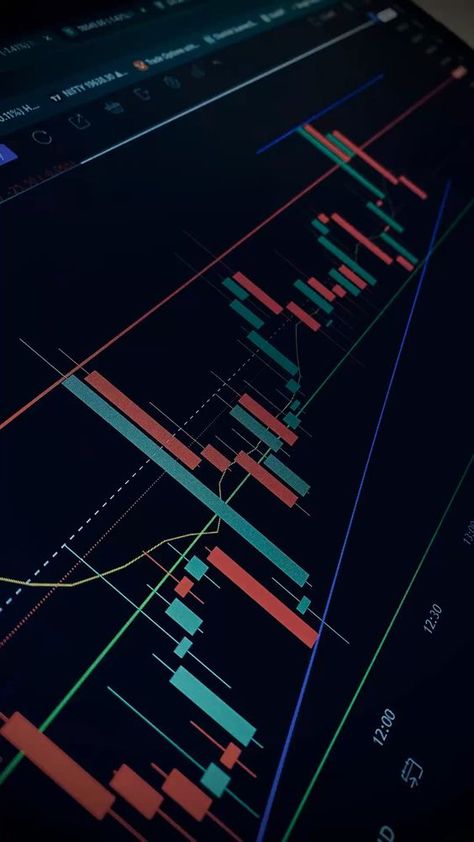
FOREX PRICE ACTION ANALYSIS
candles, candles and candles chart for candles
All candlesticks patterns
All candlesticks patterns in one chart 📉📈. #Forex #Trading #Crypto #stocks #Bitcoin
the ultimate guide to creating an effective strategy for your business infographical poster template
the different types of candles and candles on display in this info sheet, which shows how to
Forex, supply and demand
A supply and demand indicator that will help you achieve those goals of yours
an info sheet with the words, this is technical analysis and other information about how to use
the top performing s & p 500 sectores over the business cycle
The Top Performing S&P 500 Sectors Over the Business Cycle
Guide To Plan Trades
Forex traders from around the world

.
#crypto #bitcoin #cryptocurrency #blockchain #btc #ethereum #forex #money #bitcoinmining #trading #cryptocurrencies #bitcoinnews #bitcoins #cryptotrading #investment #investing #entrepreneur #cryptonews #invest #business #eth #bitcointrading #forextrader #litecoin #bitcoincash #trader #bitcoinprice #investor #forextrading #bhfypp
Indicators guide 📉📈⁠ Don’t forget to SAVE
four market phases to know it and how to use them for trading in forex
Best Way To Trade Using A Base Channel Technique In Elliott Wave Theory - Aggressivetrading
the strength of a resistance chart is shown in red, green and blue colors on a white background
the text on this tweet reads, moving average road map 5 day ema - strong momentum 10 day ema - short term trend trend
Moving Averages