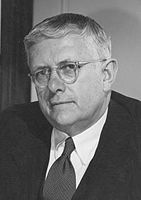
Federal elections were held in Australia on 10 December 1955. All 122 seats in the House of Representatives, and 30 of the 60 seats in the Senate were up for election. The incumbent Liberal Party of Australia led by Prime Minister of Australia Robert Menzies with coalition partner the Country Party led by Arthur Fadden defeated the Australian Labor Party led by H. V. Evatt.
Results
This would be the last federal election where any seat attracted only one candidate, who was elected unopposed.
| Popular Vote |
|
|
|
|
|
| Labor |
|
44.63% |
| Liberal |
|
39.73% |
| Country |
|
7.90% |
| ALP AC |
|
5.17% |
| Other |
|
2.56% |
| Two Party Preferred Vote |
|
|
|
|
|
| Coalition |
|
54.20% |
| Labor |
|
45.80% |
| Parliament Seats |
|
|
|
|
|
| Coalition |
|
61.48% |
| Labor |
|
38.52% |
Senate (STV) — 1955–58—Turnout 95.01% (CV) — Informal 9.63%
| |
Party |
Votes |
% |
Swing |
Seats Won |
Seats Held |
Change |
| |
Australian Labor Party |
1,803,335 |
40.61 |
−10.01 |
12 |
28 |
−1 |
| |
Liberal/Country (Joint Ticket) |
1,748,878 |
39.38 |
+12.93 |
8 |
* |
|
| |
Liberal Party of Australia |
384,732 |
8.66 |
−9.32 |
8 |
24 |
−2 |
| |
Anti-Communist Labor Party |
271,067 |
6.10 |
* |
1 |
2 |
+2 |
| |
Communist Party of Australia |
161,869 |
3.64 |
+0.59 |
0 |
0 |
0 |
| |
Country Party |
27,850 |
0.63 |
+0.63 |
1 |
6 |
+1 |
| |
Other |
43,294 |
0.97 |
|
0 |
0 |
|
| |
Total |
4,612,059 |
|
|
30 |
60 |
Seats changing hands
History
In 1949, Robert Menzies founded the Liberal Party of Australia (descended from the United Australia Party), which was led by Menzies for 16 years through successive elections with the traditional coalition in place with the Country Party. Labor stayed out of government for 23 years after the defeat of the Chifley government in 1949, largely due to the Australian Labor Party split of 1955 and the subsequent splinter-group Democratic Labor Party. Labor nevertheless won the two-party-preferred vote (the 1954, 1961 and 1969 elections), but not enough seats to form government. The election saw the peak of the Communist Party Senate vote, with 161,869 at 3.64 percent.
See also
Notes
References
- University of WA election results in Australia since 1890
- AEC 2PP vote
- Prior to 1984 the AEC did not undertake a full distribution of preferences for statistical purposes. The stored ballot papers for the 1983 election were put through this process prior to their destruction. Therefore, the figures from 1983 onwards show the actual result based on full distribution of preferences.

