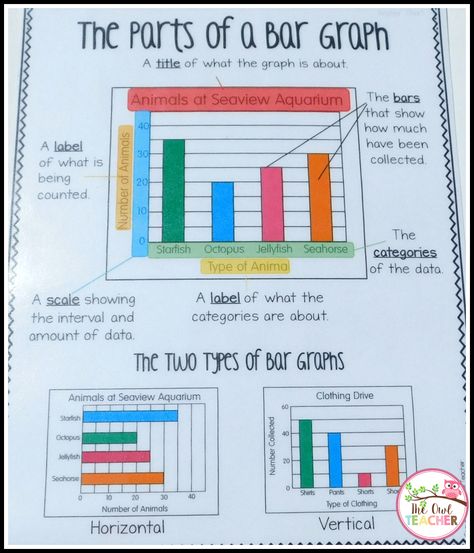
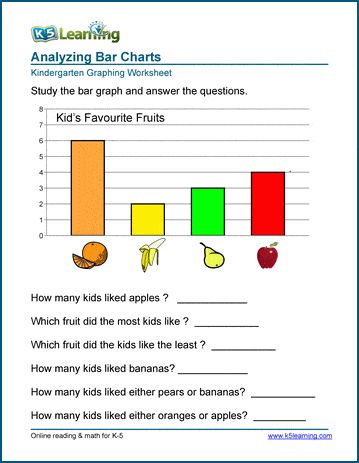
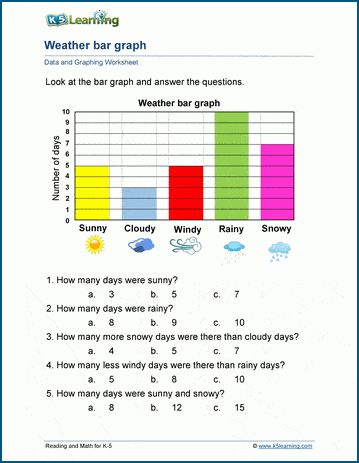
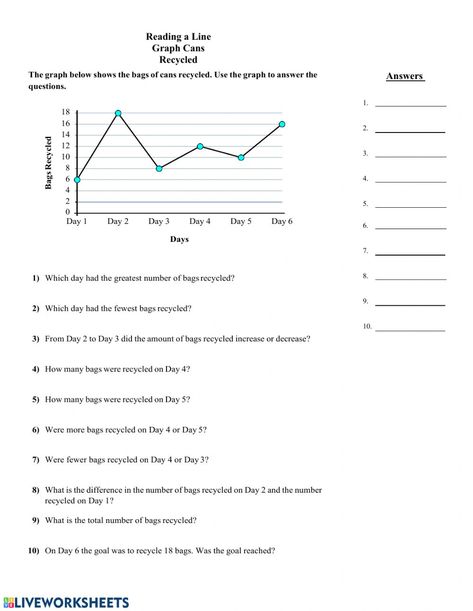
Download the worksheet for free at HERE Imagine that you are doing research on a topic and you want to group the information you have obtained, how would you do it? We can create tables, charts, graphs, pictographs, and tallies by grouping information according to their similarities and differences. Tally Chart By dividing the data into groups of 5, we can make it easier to read. In the tally chart below, after four vertical lines, a horizontal line was drawn on top of them to complete 5…
49


