Save what you love
Hover over your favorite ideas to save them to your boards.

Infographics

67 Pins
·
3y
the bar chart is shown with different colors and numbers for each part of the bar
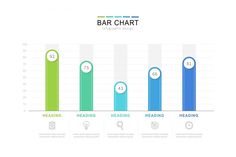
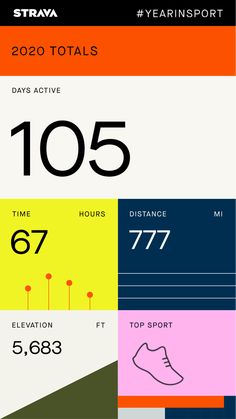
Bar chart infographic design
Elegant infographic design with colorful bar chart elements. Archive contains JPG and EPS files.
Creative Market
Creative Market 
two pictures with the same person on them
Туалетный юмор (подборка)
Туалетный юмор (подборка) / Ванная комната, туалет и зеркала / ВТОРАЯ УЛИЦА
the different types of food and drink icons are shown in black on a white background
Plus X Creative Partner
the restroom icons are orange and white
9 Residence / Indigo
Graphic icons for the project.
an image of four people with different colors and shapes on them, one is looking at the
BH
an info board with different times and numbers
My Strava Year in Sport Stats
Heating UI  Animation by Daniel Montgomery #Design Popular #Dribbble #shots Thermostat Ui Design, Honeywell 5-2 Day Thermostat Manual, Design Ui, Ui Ux 디자인, Ui Animation, Timeline Design, Graph Design, Presentation Layout, Website Design Layout
Heating UI — Animation
Heating UI Animation by Daniel Montgomery #Design Popular #Dribbble #shots
the number thirteen seven is circled by a blue circle on a white background that reads,'1387 '
Android Spinner
Interesting spinner, could be used to display scores / percentages etc
the number four is shown in blue and has an image of a ball on it
the logo for 2 6 million americans
Guam Veteran Infographic
Guam Veteran Infographic by Dialogue Theory
the words 795 million people on a blue background
Slot Machine Animation
a blue and white circle with the words up to 45 %
Radial Graph Animation
two circles with the numbers twenty and thirty on them, one has an arrow pointing to the
Circular Percentage Graph
a blue and white poster with information on it
Talkin' 'Bout Your Generation
A useful & unique overview of Generational Cohorts brought to you by GENX. #Millennial #Boomer #GenZ #GenX #Infographic #Cohorts #GenerationalCohorts
an info sheet showing the different types of aircrafts
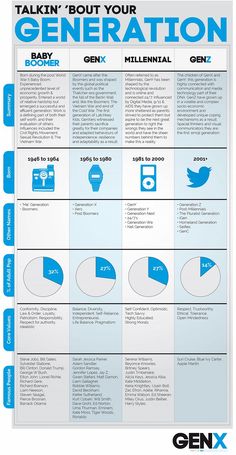
4-Generation Family Tree Diagram Template - Venngage
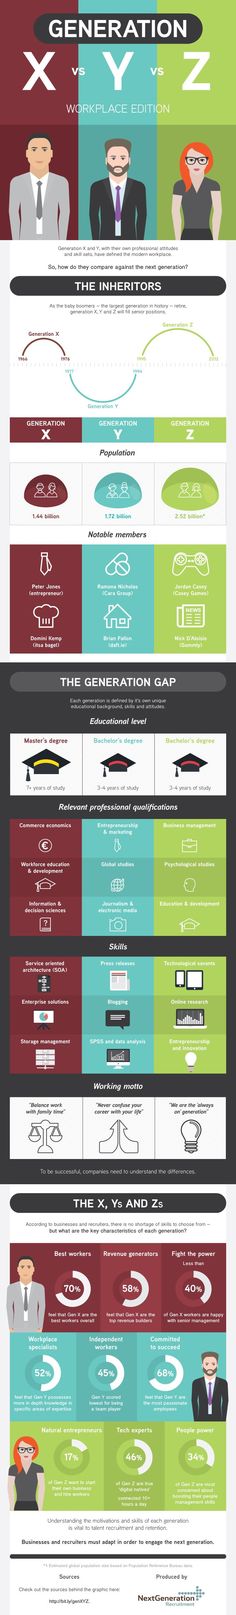
GENERATION X VS GENERATION Y VS GENERATION Z COMPARISON INFOGRAPHIC /// Making a comparison infographic just got easier! Transform your infographic ideas with the simple techniques used in this template. This designer used columns to compare the difference between Generations X, Y, and Millennials. By adding columns it makes it easy for the reader to follow especially when you use visual groupings. Varying the colors helps to visualize the data and keeps a consistent flow. You can break up…