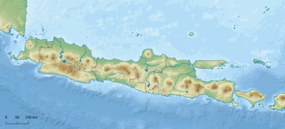
The Porong River is a river flowing through Sidoarjo, East Java, Indonesia, about 700 km east of the capital Jakarta.[1][2] It is one of the main distributaries of the Brantas River that discharges into the Bali Sea, close to the Madura Strait, and is the main outlet for the Lusi mudflow.
| Porong River Kali Porong, Sungai Porong, Kali Torong | |
|---|---|
 | |
| Location | |
| Country | Indonesia |
| Province | East Java |
| Physical characteristics | |
| Source | Brantas River |
| • location | Mojokerto |
| Mouth | |
• location | Madura Strait |
• elevation | 0 m (0 ft) |
| Length | 13.5 km (8.4 mi) |
| Basin size | 480 km2 (190 sq mi) |
Geography
editThe river flows in the eastern area of Java with a predominantly tropical monsoon climate (designated as Am in the Köppen–Geiger climate classification).[3] The annual average temperature in the area is 26 °C. The warmest month is October when the average temperature is around 28 °C, and the coldest is February, at 22 °C o average.[4] The average annual rainfall is 2473 mm. The wettest month is January, with an average of 426 mm of rainfall, and the driest is August, with an average rainfall of 20 mm .[5]
| Porong River | ||||||||||||||||||||||||||||||||||||||||||||||||||||||||||||
|---|---|---|---|---|---|---|---|---|---|---|---|---|---|---|---|---|---|---|---|---|---|---|---|---|---|---|---|---|---|---|---|---|---|---|---|---|---|---|---|---|---|---|---|---|---|---|---|---|---|---|---|---|---|---|---|---|---|---|---|---|
| Climate chart (explanation) | ||||||||||||||||||||||||||||||||||||||||||||||||||||||||||||
| ||||||||||||||||||||||||||||||||||||||||||||||||||||||||||||
| ||||||||||||||||||||||||||||||||||||||||||||||||||||||||||||
See also
editReferences
edit- ^ Rand McNally, The New International Atlas, 1993.
- ^ Kali Porong at Geonames.org (cc-by); Last updated 2013-06-04; Database dump downloaded 2015-11-27
- ^ Peel, M C; Finlayson, B L; McMahon, T A (2007). "Updated world map of the Köppen-Geiger climate classification". Hydrology and Earth System Sciences. 11: 1633–1644. doi:10.5194/hess-11-1633-2007. Retrieved 30 January 2016.
- ^ a b "NASA Earth Observations Data Set Index". NASA. 30 January 2016.
- ^ "NASA Earth Observations: Rainfall (1 month - TRMM)". NASA/Tropical Rainfall Monitoring Mission. 30 January 2016.

