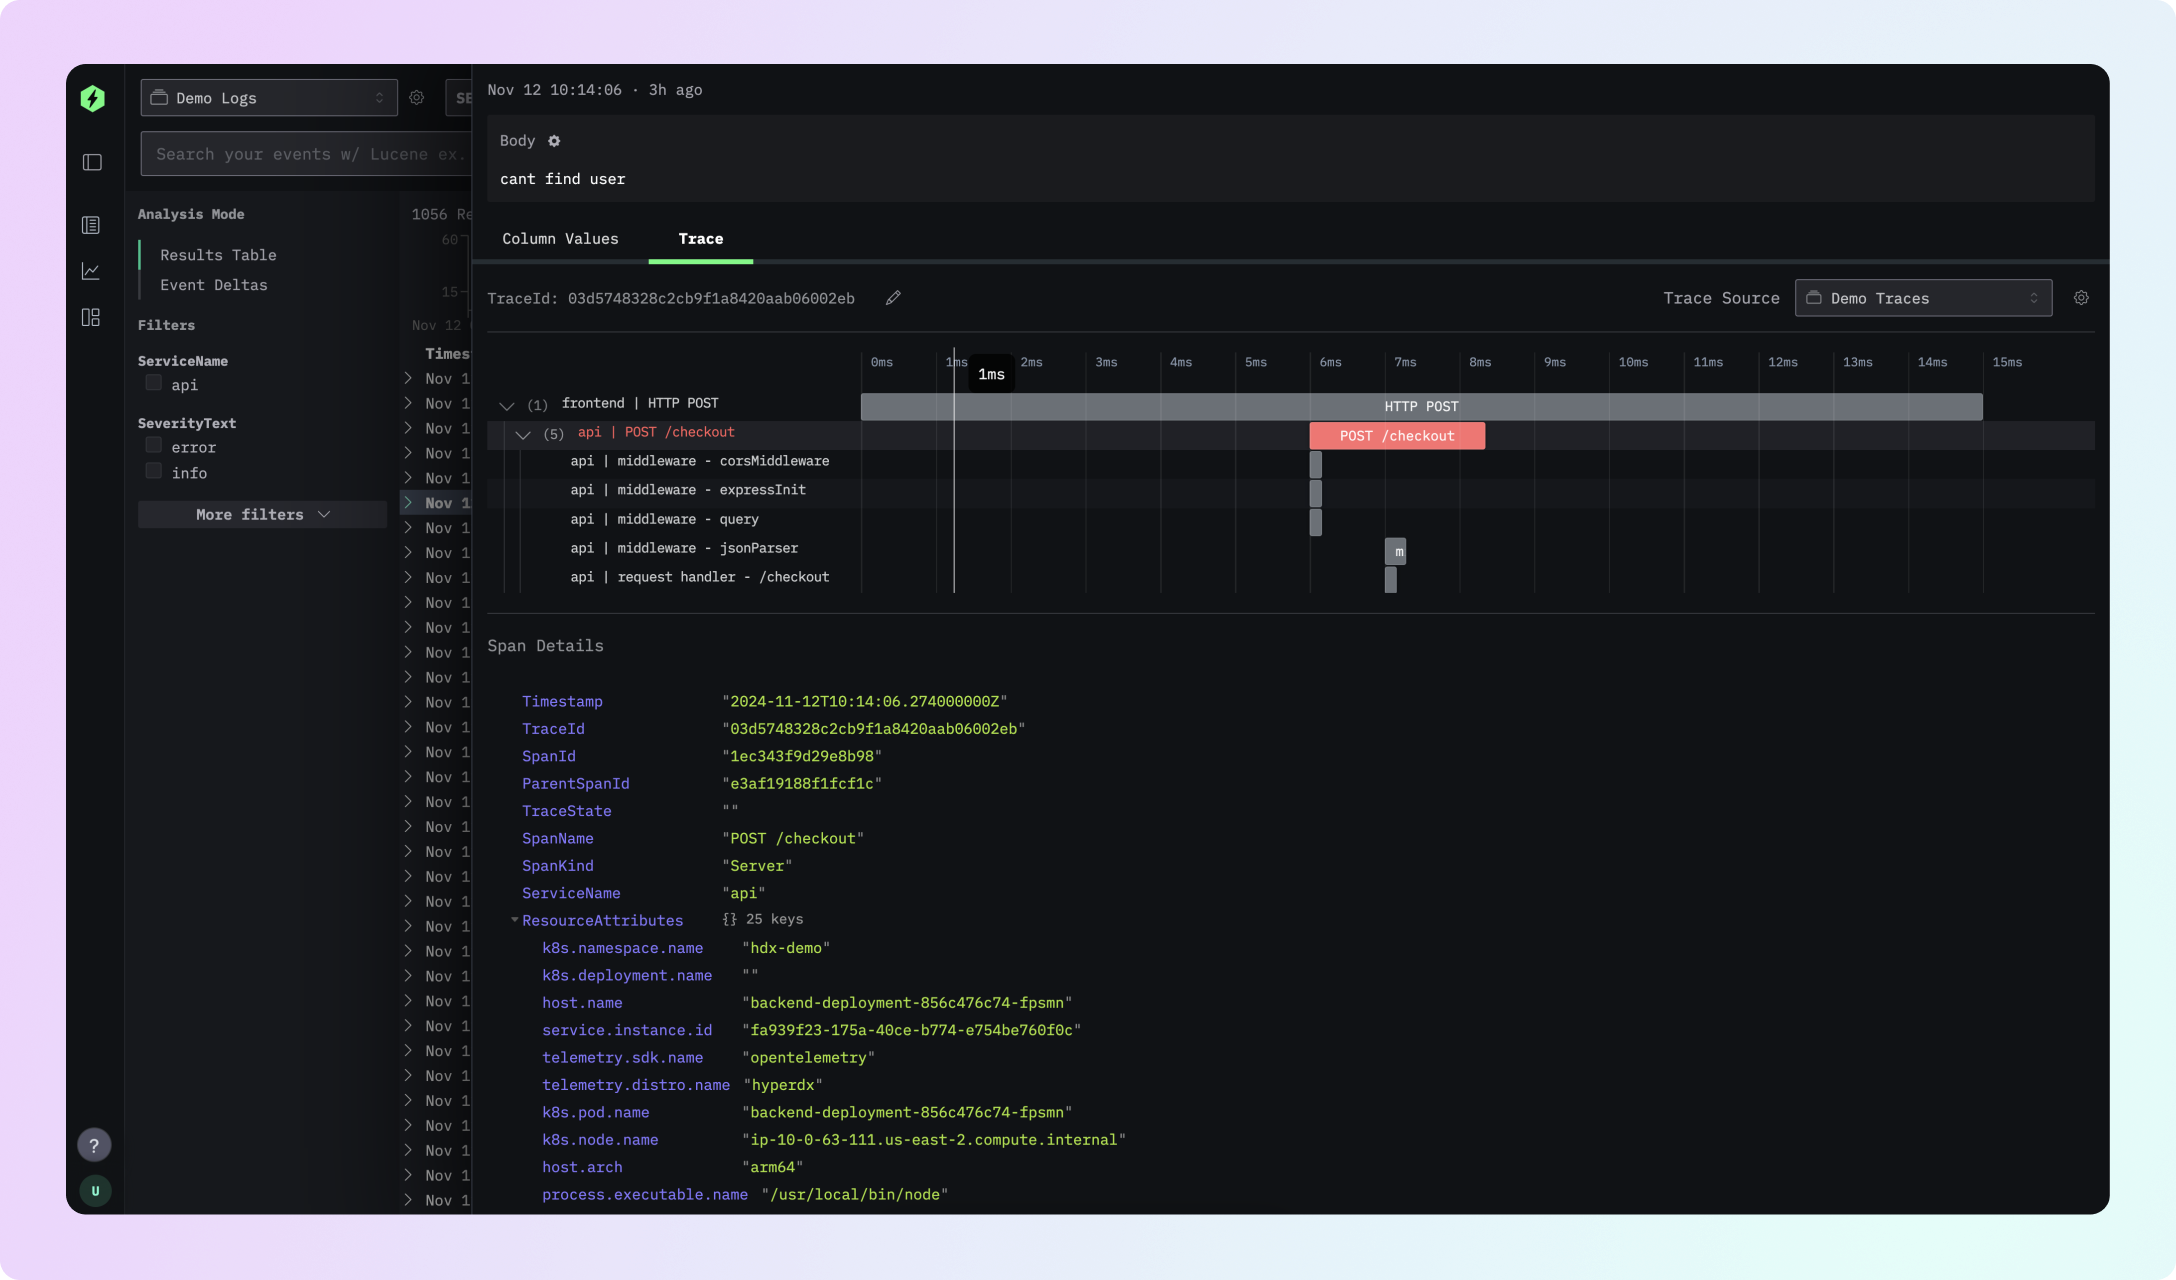
HyperDX helps engineers quickly figure out why production is broken by making it easy to search & visualize logs and traces on top of any Clickhouse cluster (imagine Kibana, for Clickhouse).
Documentation • Chat on Discord • Live Demo • Bug Reports • Contributing • Website
- 🕵️ Correlate/search logs and traces all in one place
- 📝 Schema agnostic, works on top of your existing Clickhouse schema
- 🔥 Blazing fast searches & visualizations optimized for Clickhouse
- 🔍 Intuitive full-text search and property search syntax (ex.
level:err), SQL optional! - 📊 Analyze trends in anomalies with event deltas
- 📈 Dashboard high cardinality events without a complex query language
{Native JSON string querying- ⚡ Live tail logs and traces to always get the freshest events
- 🔭 OpenTelemetry supported out of the box
- ⏱️ Monitor health and performance from HTTP requests to DB queries (APM)
HyperDX can be deployed in a few different ways depending on your needs. The easiest way to get started from scratch is to start the complete stack via Docker Compose. Which will start an OpenTelemetry collector, Clickhouse, and HyperDX with a MongoDB and Redis instance.
After cloning this repository, simply start the stack with:
docker compose up -dAfterwards, you can visit http://localhost:8080 to access the HyperDX UI. MongoDB and Redis instance.
If you already have an existing ClickHouse instance, want to use a single container locally, or are looking for production deployment instructions, you can view the different deployment options in our DEPLOY.md.
If your server is behind a firewall, you'll need to open/forward port 8080, 8000 and 4318 on your firewall for the UI, API and OTel collector respectively.
We recommend at least 4GB of RAM and 2 cores for testing.
Note: HyperDX v2 is currently in beta for local mode.
You can get started by standing up the HyperDX local container, which will run an OpenTelemetry collector (on port 4317), Clickhouse (on port 8123), and the HyperDX UI (on port 8080).
You can spin up the container with the following command:
docker run -p 8080:8080 -p 8123:8123 -p 4317:4317 -p 4318:4318 docker.hyperdx.io/hyperdx/hyperdx-local:2-betaAfterwards, you can visit http://localhost:8080 to access the HyperDX UI. If you're connecting to an external Clickhouse cluster, you can simply just forward port 8080 and set up the connection in the UI.
Safari & Brave Browser Users: There are known issues with Safari & Brave's CORS implementation that can prevent connecting to Clickhouse in local mode. We recommend using another browser in the interim.
We recommend having at least 1GB of RAM and 1 CPU core available for the container if using the included OpenTelemetry collector and Clickhouse server.
HyperDX is also available as a hosted cloud service at hyperdx.io. You can sign up for a free account and start sending data in minutes.
To get logs, metrics, traces, session replay, etc into HyperDX, you'll need to instrument your app to collect and send telemetry data over to your HyperDX instance.
We provide a set of SDKs and integration options to make it easier to get started with HyperDX, such as Browser, Node.js, and Python
You can find the full list in our docs.
OpenTelemetry
Additionally, HyperDX is compatible with OpenTelemetry, a vendor-neutral standard for instrumenting your application backed by CNCF. Supported languages/platforms include:
- Kubernetes
- Javascript
- Python
- Java
- Go
- Ruby
- PHP
- .NET
- Elixir
- Rust
(Full list here)
Once HyperDX is running, you can point your OpenTelemetry SDK to the
OpenTelemetry collector spun up at http://localhost:4318.
We welcome all contributions! There's many ways to contribute to the project, including but not limited to:
- Opening a PR (Contribution Guide)
- Submitting feature requests or bugs
- Improving our product or contribution documentation
- Voting on open issues or contributing use cases to a feature request
Our mission is to help engineers ship reliable software. To enable that, we believe every engineer needs to be able to easily leverage production telemetry to quickly solve burning production issues.
However, in our experience, the existing tools we've used tend to fall short in a few ways:
- They're expensive, and the pricing has failed to scale with TBs of telemetry becoming the norm, leading to teams aggressively cutting the amount of data they can collect.
- They're hard to use, requiring full-time SREs to set up, and domain experts to use confidently.
- They requiring hopping from tool to tool (logs, session replay, APM, exceptions, etc.) to stitch together the clues yourself.
We're still early on in our journey, but are building in the open to solve these key issues in observability. We hope you give HyperDX a try and let us know how we're doing!
HyperDX is open core, with most of our features available here under an MIT license. We have a cloud-hosted version available at hyperdx.io with a few additional features beyond what's offered in the open source version.
Our cloud hosted version exists so that we can build a sustainable business and continue building HyperDX as an open source platform. We hope to have more comprehensive documentation on how we balance between cloud-only and open source features in the future. In the meantime, we're highly aligned with Gitlab's stewardship model.
HyperDX v2 is currently in early beta, with the goals of accomplishing deployment simplicity, native SQL support, and improved performance for PB+ deployments. Currently we've released a subset of features with the goal of getting early feedback from the community.
Here's a high-level list of support we're working on delivering as part of v2:
- Log & Trace Search w/ Lucene & SQL
- Charting & Dashboarding
- Event Deltas
- Performance Improvements
- Authentication & Saving Sources/Connections
- Saved Searches & Dashboards
- Alerting
- PromQL-based Metrics
- OTLP/SQL-based Metrics
- Browser Monitoring/Session Replay
- Raw SQL Charting
- Improved Custom Domain/TLS Support
- Official Helm Chart
- v1 Migration Tooling
- Public API

