Pedometric mapping
Pedometric mapping, or statistical soil mapping, is data-driven generation of soil property and class maps that is based on use of statistical methods.[1][2][3] The main objective of pedometric mapping is to predict values of some soil variable at unobserved locations and access the uncertainty of that estimate using statistical inference i.e. statistically optimal approaches. From the application point of view, the main objective of soil mapping is to accurately predict response of a soil-plant ecosystem to various soil management strategies. In other words, the main objective of pedometric mapping is to generate maps of soil properties and soil classes that can be used to feed other environmental models or for decision making. Pedometric mapping is largely based on applying geostatistics in soil science and other statistical methods used in pedometrics.
Although pedometric mapping is mainly data-driven, it can also largely be based on use of expert knowledge. The expert knowledge, however, needs to be plugged-in into a pedometric computational framework so that it can be used to produce more accurate prediction models. For example, data assimilation techniques, such as the space–time Kalman filter, can be used to integrate pedogenetic knowledge and field observations.[4]
In the information theory context, the objective of pedometric mapping is to describe the spatial complexity of soils (information content of soil variables over a geographical area), then represent this complexity using maps, summary measures, mathematical models and simulations.[5] Simulations are a preferred way of visualizing soil patterns as they represent both the deterministic pattern due to the landscape, geographic hot-spots and short range variability (see image below).[citation needed]
Contents
Pedometric vs traditional soil mapping
In traditional soil survey, spatial distribution of soil properties and soil bodies can be inferred using mental models which leads to manual delineations. Such methods can be considered to be subjective, and it is hence difficult or impossible to statistically assess the accuracy of such maps without additional field sampling. Traditional soil survey mapping has some limitations for use in a multithematic GIS related to the fact that is often not consistently applied by different mappers, it is largely manual and it is difficult to automate. Most of traditional soil maps in the world are based on manual delineations of assumed soil bodies, to which then soil attributes are attached.[6][7] In the case of pedometric mapping, all outputs are based on using rigorous statistical computing and are hence reproducible.
Pedometric mapping is largely based on using extensive and detailed covariate layers such as Digital Elevation Model (DEM) derivatives, remote sensing imagery, climatic, land cover and geological GIS layers and imagery. Evolution of pedometric mapping can be closely connected with the emergence of new technologies and global, publicly available data sources such as the SRTM DEM, MODIS, ASTER and Landsat imagery, gamma radiometrics and LiDAR imagery, and new automated mapping methods.
| Expert/knowledge-driven soil mapping | Data/technology-driven (pedometric) soil mapping | |
|---|---|---|
| Target variables: | Soil types (soil series) | Analytical soil properties |
| Spatial data model: | Discrete (soil bodies) | Continuous/hybrid (quantities / probabilities) |
| Major inputs: | Expert knowledge / soil profile description | Laboratory data / proximal soil sensing |
| Important covariates: | Soil delineations (photo-interpretation) | Remote sensing images, DEM-derivatives |
| Spatial prediction model: | Averaging per polygon | Automated (geo)statistics |
| Accuracy assessment: | Validation of soil mapping units (kappa) | Cross-validation (RMSE) |
| Data representation: | Polygon maps + attribute tables (2D) | Gridded maps (2D/3D) + prediction error map or simulations |
| Major technical aspect: | Cartographic scale | Grid cell size |
| Soil sampling strategies: | Free survey (surveyor selects sampling locations) | Statistical (design/model-based sampling designs) |
Pedometric mapping methods
Pedometric mapping methods differ based on the soil survey data processing steps:
- Sampling
- Data screening
- Preprocessing of soil covariates
- Fitting of geostatistical model
- Spatial prediction
- Cross-validation / accuracy assessment
- Visualization of outputs
One of the main theoretical basis for pedometric mapping is the universal model of soil variation:[4][8]
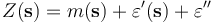
where Failed to parse (Missing <code>texvc</code> executable. Please see math/README to configure.): \textstyle{m(\mathbf{s})}
is the deterministic part of soil variation, Failed to parse (Missing <code>texvc</code> executable. Please see math/README to configure.): \textstyle{\varepsilon '(\mathbf{s})}
is the stochastic, spatially auto-correlated part of variation, and Failed to parse (Missing <code>texvc</code> executable. Please see math/README to configure.): \textstyle{\varepsilon ''}
is the remaining residual variation (measurement errors, short-range variability etc.) that is also possibly dependent on Failed to parse (Missing <code>texvc</code> executable. Please see math/README to configure.): \textstyle{\mathbf{s}}
, but it is not modeled. This model has been first time introduced by French mathematician Georges Matheron, and has shown to be the Best Unbiased Linear Predictor for spatial data. One way of using this model to produce predictions or simulations is by means of regression-kriging (also known as universal kriging). In the case of soil data, the deterministic component of the model is often modeled using the soil forming factors: climate, organism, relief, parent material, or lithology, and time. This conceptual model is known as the CLORPT model, and has been the first time introduced to soil-landscape modelling by Hans Jenny.[2]
A special group of techniques of pedometric mapping focus on downscaling the spatial information that can be area-based or continuous. Prediction of soil classes is also another sub-field of pedometric mapping where specific geostatistical methods are used for the purpose of interpolation of factor-type of variables.
Pedometric mapping is also largely based on using novel technologies for measuring soil properties, also referred to as the digital soil mapping techniques. These include:
- Soil spectroscopy and proximal soil sensing (hand-held or vehicle-driven devices)
- Remote sensing systems for mapping and monitoring soils (e.g. SMOS)
- LiDAR technology to produce digital elevation models
- Precision agriculture technologies
References
- ↑ Lua error in package.lua at line 80: module 'strict' not found.
- ↑ 2.0 2.1 Lua error in package.lua at line 80: module 'strict' not found.
- ↑ Lua error in package.lua at line 80: module 'strict' not found.
- ↑ 4.0 4.1 Lua error in package.lua at line 80: module 'strict' not found.
- ↑ Lua error in package.lua at line 80: module 'strict' not found.
- ↑ Lua error in package.lua at line 80: module 'strict' not found.
- ↑ Lua error in package.lua at line 80: module 'strict' not found.
- ↑ Lua error in package.lua at line 80: module 'strict' not found.
External links
- Pedometrics Commission of the International Union of Soil Sciences
- ISRIC — World Soil Information data centre
- International Society for Geomorphometry
- Open Source tools for soil scientists by the California Soil Resource Lab
