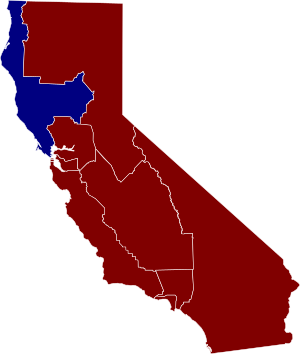
United States House of Representatives elections in California, 1928
From Infogalactic: the planetary knowledge core
|
||||||||||||||||||||||
|
All 11 California seats to the United States House of Representatives |
||||||||||||||||||||||
|---|---|---|---|---|---|---|---|---|---|---|---|---|---|---|---|---|---|---|---|---|---|---|
|
||||||||||||||||||||||

Republican hold Democratic hold
|
||||||||||||||||||||||
Lua error in package.lua at line 80: module 'strict' not found.
The United States House of Representatives elections in California, 1928 was an election for California's delegation to the United States House of Representatives, which occurred as part of the general election of the House of Representatives on November 6, 1928. California's House delegation remained unchanged at 10 Republicans and 1 Democrat.
Contents
Overview
| United States House of Representatives elections in California, 1928 | |||||
|---|---|---|---|---|---|
| Party | Votes | Percentage | Seats | ||
| Republican | 1,127,910 | 85.1% | 10 | ||
| Democratic | 172,250 | 13.0% | 1 | ||
| Independent | 16,838 | 1.3% | 0 | ||
| Socialist | 8,090 | 0.6% | 0 | ||
| Totals | 1,325,088 | 100.0% | 11 | ||
Results
Final results from the Clerk of the House of Representatives: [1]
District 1
| California's 1st congressional district election, 1928 | ||||
|---|---|---|---|---|
| Party | Candidate | Votes | % | |
| Democratic | Clarence F. Lea (incumbent) | 56,381 | 100.0 | |
| Voter turnout | % | |||
| Democratic hold | ||||
District 2
| California's 2nd congressional district election, 1928 | ||||
|---|---|---|---|---|
| Party | Candidate | Votes | % | |
| Republican | Harry Lane Englebright (incumbent) | 32,455 | 100.0 | |
| Voter turnout | % | |||
| Republican hold | ||||
District 3
| California's 3rd congressional district election, 1928 | ||||
|---|---|---|---|---|
| Party | Candidate | Votes | % | |
| Republican | Charles F. Curry (incumbent) | 77,750 | 100.0 | |
| Voter turnout | % | |||
| Republican hold | ||||
District 4
| California's 4th congressional district election, 1928 | ||||
|---|---|---|---|---|
| Party | Candidate | Votes | % | |
| Republican | Florence Prag Kahn (incumbent) | 50,206 | 76 | |
| Independent | Harry W. Hutton | 16,838 | 24 | |
| Total votes | 67,044 | 100 | ||
| Voter turnout | % | |||
| Republican hold | ||||
District 5
| California's 5th congressional district election, 1928 | ||||
|---|---|---|---|---|
| Party | Candidate | Votes | % | |
| Republican | Richard J. Welch (incumbent) | 51,708 | 100.0 | |
| Voter turnout | % | |||
| Republican hold | ||||
District 6
| California's 6th congressional district election, 1928 | ||||
|---|---|---|---|---|
| Party | Candidate | Votes | % | |
| Republican | Albert E. Carter (incumbent) | 113,579 | 100.0 | |
| Voter turnout | % | |||
| Republican hold | ||||
District 7
| California's 7th congressional district election, 1928 | ||||
|---|---|---|---|---|
| Party | Candidate | Votes | % | |
| Republican | Henry E. Barbour | 71,195 | 100.0 | |
| Voter turnout | % | |||
| Republican hold | ||||
District 8
| California's 8th congressional district election, 1928 | ||||
|---|---|---|---|---|
| Party | Candidate | Votes | % | |
| Republican | Arthur M. Free (incumbent) | 80,613 | 68 | |
| Democratic | Cecelia M. Casserly | 37,947 | 32 | |
| Total votes | 118,560 | 100 | ||
| Voter turnout | % | |||
| Republican hold | ||||
District 9
| California's 9th congressional district election, 1928 | ||||
|---|---|---|---|---|
| Party | Candidate | Votes | % | |
| Republican | William E. Evans (incumbent) | 222,261 | 77.0 | |
| Democratic | James B. Ogg | 58,263 | 20.2 | |
| Socialist | Christian Sorenson | 8,090 | 2.8 | |
| Total votes | 288,614 | 100.0 | ||
| Voter turnout | % | |||
| Republican hold | ||||
District 10
| California's 10th congressional district election, 1928 | ||||
|---|---|---|---|---|
| Party | Candidate | Votes | % | |
| Republican | Joe Crail (incumbent) | 301,028 | 93.9 | |
| Democratic | Harry Sherr | 19,659 | 6.1 | |
| Total votes | 320,687 | 100.0 | ||
| Voter turnout | % | |||
| Republican hold | ||||
District 11
| California's 11th congressional district election, 1928 | ||||
|---|---|---|---|---|
| Party | Candidate | Votes | % | |
| Republican | Philip D. Swing (incumbent) | 127,115 | 100.0 | |
| Voter turnout | % | |||
| Republican hold | ||||
See also
- 71st United States Congress
- Political party strength in California
- Political party strength in U.S. states
- United States House of Representatives elections, 1928
References
External links
- California Legislative District Maps (1911-Present)
- RAND California Election Returns: District Definitions
Lua error in package.lua at line 80: module 'strict' not found.