Reversal Pattern ChartReversal Chart PatternsBullish PatternsBullish Reversal PatternChart Patterns Trading PdfForex Reversal PatternsBullish Candlestick PatternsNzdchf Forex Chart AnalysisChart Patterns TradingReversal Pattern Chart751
Chart Patterns TradingStock Market ChartCandlestick Chart PatternsCandle Stick PatternsBollinger BandsStock Chart PatternsOnline Stock TradingForex Trading TrainingStock Trading StrategiesClassic chart patternsHere some are importnat chart patterns With help of them you can bright your trading carior.164
Trading Chat PatternsTrend Reversal PatternsReversal Pattern ChartBullish PatternsBullish Reversal PatternBullish Chart PatternsDouble Bottom Chart PatternDouble Bottom Pattern TradingReversal Candlestick PatternsTrading Chat Patterns✅ Bullish reversal patterns are formations that suggest a change in the prevailing trend from down to up. -These patterns can be found on price charts and are used by technical analysts to help predict future price movements. -The three most common bullish reversal patterns are the head and shoulders, the inverted head and shoulders, and the double bottom. 📌 I have created a helpful 3-step course for all new traders called the Equity & Options MasterClass 🔗Grab it on my website (Link in Bi824
Stock IndicatorsTreading Chart PatternStock Trends ChartsReversal Chart PatternsTechnical Analysis StrategiesTechnical Chart PatternTriple Bottom Chart PatternDouble Bottom Chart PatternTechnical Analysis PatternsStock Indicators1.2k
Bullish Candlestick PatternsStock Chart PatternsOnline Stock TradingStock Trading StrategiesCandlestick ChartIntraday TradingStock ChartsCandlestick PatternsTrading ChartsDouble bottom formation on a real chartA double bottom formation is a bullish reversal pattern that occurs when the price of an asset hits a support level twice and then reverses upward. It can be identified by two troughs that form at approximately the same level, with a peak in between them. The pattern is complete when the price breaks above the peak between the two troughs, indicating a potential trend reversal.36
Forex Chart Patterns PdfForex Lot Size ChartPlanning ExcelUsdjpy Weekly Forex ChartForex Trading Strategies PdfReal-time Forex ChartBollinger BandsStock Chart PatternsForex Trading TrainingForex Chart Patterns Pdf530
Trend Reversal PatternsReversal Pattern ChartReversal Chart PatternsBullish PatternsBullish Chart PatternsBreakout Chart PatternsHead And Shoulders PatternChart PatternsBearish Chart PatternsTrend Reversal Patterns946
Chart Patterns TradingCandle Stick PatternsForex Trading QuotesStock Chart PatternsForex Trading Strategies VideosTechnical Analysis ChartsOnline Stock TradingForex Trading TrainingStock Trading StrategiesSame Rules in Forex AnalysisForex Trading #forextrading #forextrading #strategies #trading #trader #stock #market #cryptocurrency #crypto #bitcoin #trading #forex @forexhq @forexedukacja @Forex_Market_Empire180
Trend Reversal PatternsHead And Shoulder Chart PatternHead And Shoulders PatternHead And Shoulders Pattern Trading StrategyTrading Charts Patterns PdfForex Trading Graph AnalysisCandlestick Patterns Cheat SheetHead And ShouldersChart Patterns TradingHead and shoulders patternOn the technical analysis chart, the head and shoulders formation occurs when a market trend is in the process of reversal either from a bullish or bearish trend; a characteristic pattern takes shape and is recognized as reversal formation.839
Double Top Chart PatternDouble Top Pattern TradingDaily Forex Chart PatternsForex Reversal PatternsLot Size In Forex TradingChart Patterns TradingStrategy InfographicForex Trading QuotesStock Chart Patterns1✅ The Double Top pattern can be used to find good sell positions. - When the 'M' formation is formed, - it is a sign of reversal as the price of a currency or asset has also rejected the same area twice consecutively. - When using chart patterns always look for multiple confluences to increase trade accuracy. 📌 I have created a helpful 3-step course for all new traders called the Equity & Options MasterClass . It's the top 5 Setups which has over only 3% loosing ratio ! That means it has 9480
Chart Patterns TradingCandlestick Chart PatternsIlmu EkonomiCandle Stick PatternsStock Chart PatternsTechnical Analysis ChartsStock Market QuotesForex Trading TipsStock Trading StrategiesChart Patterns Trading2.8k
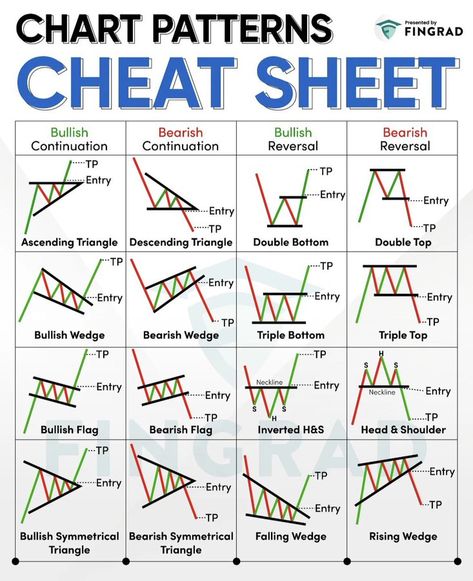
Chart SheetAll Chart PatternsClassic Chart PatternsCharts PatternsBanknifty Chart PatternForex PatternsTrading Chart PatternTrading Patterns Cheat SheetChat Patterns TradingChart Patterns Cheat Sheet PDF | PDFChart Patterns Cheat Sheet.pdf - Free download as PDF File (.pdf), Text File (.txt) or read online for free. This document provides a cheat sheet of common chart patterns in technical analysis. It lists reversal patterns like double tops and head and shoulders that indicate a change in trend. Continuation patterns like falling and rising wedges suggest the trend will continue. Bilateral patterns including ascending, descending, and symmetrical triangles can be either reversal or continuation…4.4k
Continuation PatternsReversal Chart PatternsTrade PatternsReversal PatternsTrading PatternsTrading Reversal PatternsFinancial Trading Chart PatternCrypto PatternsPole Pattern Trading StrategyContinuation Patterns2.2k
Stock Market InvestingCandlestick PatternsHead & ShouldersCheat SheetsTechnical AnalysisTrading StrategiesStock MarketEducationMarketingStock Market Investing📈 Master Chart Pattern Reversals with Our Cheat Sheet 📉 Understanding reversal patterns is key to identifying potential trend changes in the market. Use this guide to familiarize yourself with both bearish and bullish reversal patterns: Bearish Reversal Patterns: - Bearish Double Top - Bearish Head and Shoulders - Bearish Rising Wedge - Bearish Expanding Triangle - Bearish Triple Top Bullish Reversal Patterns: - Bullish Double Bottom - Bullish Inverted Head and Shoulders - Bullish…7
Beginner Trading Guide PdfTechnical Analysis For Crypto TradersGood Boy QuotesChart Patterns TradingStock Market ChartArbitrage TradingReal-time Trading AnalysisCandlestick Chart PatternsCandle Stick PatternsCup & Handle patternCup & Handle pattern861
How To Share Pdf On Google DriveCreperia IdeasForex Candlestick PatternsGoogle Drive Download GuideJapanese Candlesticks PatternsGoogle Drive Rar FilePdf File Link On Google DriveCandlestick Chart PatternsPowerless Pdf Google DriveBest Forex Candlestick Patterns Indicator MT4 (2025)Candlestick patterns indicators guide you about candle next target in term of analysis. Candlestick pattern chart is most power idea for trading and play key role in turning points in any market pair. You also can understand complete about candlestick chart PDF for more details with trading role and daily market trend analysis in Forex.20
Bullish Candlestick PatternsChart Patterns TradingCandlestick Chart PatternsCandle Stick PatternsForex Trading QuotesStock Chart PatternsForex Trading Strategies VideosTechnical Analysis ChartsMateri Bahasa JepangHow to Read Candlestick Charts Like a ProCandlestick patterns are powerful tools for traders, helping them predict market movements with accuracy. In this guide, we explore the most important candlestick formations, from bullish and bearish patterns to reversals and continuations. Learn how to read candlestick charts, identify profitable trading opportunities, and avoid common mistakes. Whether you're a beginner or an experienced trader, mastering candlestick patterns can give you a strategic edge in the market898
All Chart Patterns TradingForex Chart Patterns PdfReversal Candlestick Patterns Cheat SheetChart Patterns Trading Pdf Book FreePrice Action Trading Patterns PdfTechnical Analysis ChartsTrade FinanceSaving Money BudgetCartoon Wallpaper HdTechnical Analysis -Chart Patterns. Smc chart patterns.Here are some common chart patterns that are important to know for traders and investors. These include bilateral patterns, reversal patterns, continuation patterns, and more if you click the image101
Chart Patterns Trading BookTrading Charts Patterns PdfTechnical Trading Chart With Trend LinesCurrency Trading Chart With Technical IndicatorsAscending TriangleTechnical Analysis For Forex TradersStock Chart PatternsSelf Fulfilling ProphecyStock AnalysisThe Top Chart Patterns You Need to Know and How to Trade ThemThis post will show you all the top chart patterns you need to know if you're getting into trading. History repeats itself. This is true in life and in the stock market as well. That's why chart patterns exist in stock trading. Over the years, we've seen basically every single kind of chart pattern many times. They don't always go according to plan, sometimes chart patterns will break down, but often times they will work. Check out the post to learn more. #stocks #trading #invest…8
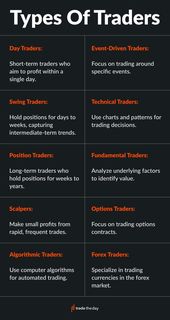
Stock Market TrendsChart Patterns TradingStock Market ChartCandle Stick PatternsForex Trading QuotesStock Chart PatternsTechnical Analysis ChartsLearn Forex TradingForex Trading TrainingStrength Of SupportLearn to identify trends and trend reversals in the market. Understand the market's two types of trends: uptrend and downtrend. #forex #trading #forextrading #stocks #investing #finance #forexmarket #daytrading #trader #currencies #fx #forextrader #technicalanalysis211