

VChart
Data StorytellerStar On Github

Out-of-the-box multi-terminal charting library
Vivid and flexible data storyteller
Learn once, write anywhere
VCHART
A code, automatically adapts to desktop, H5, web pages, mobile phone applets and other environments.

Usage Scenario Introduction

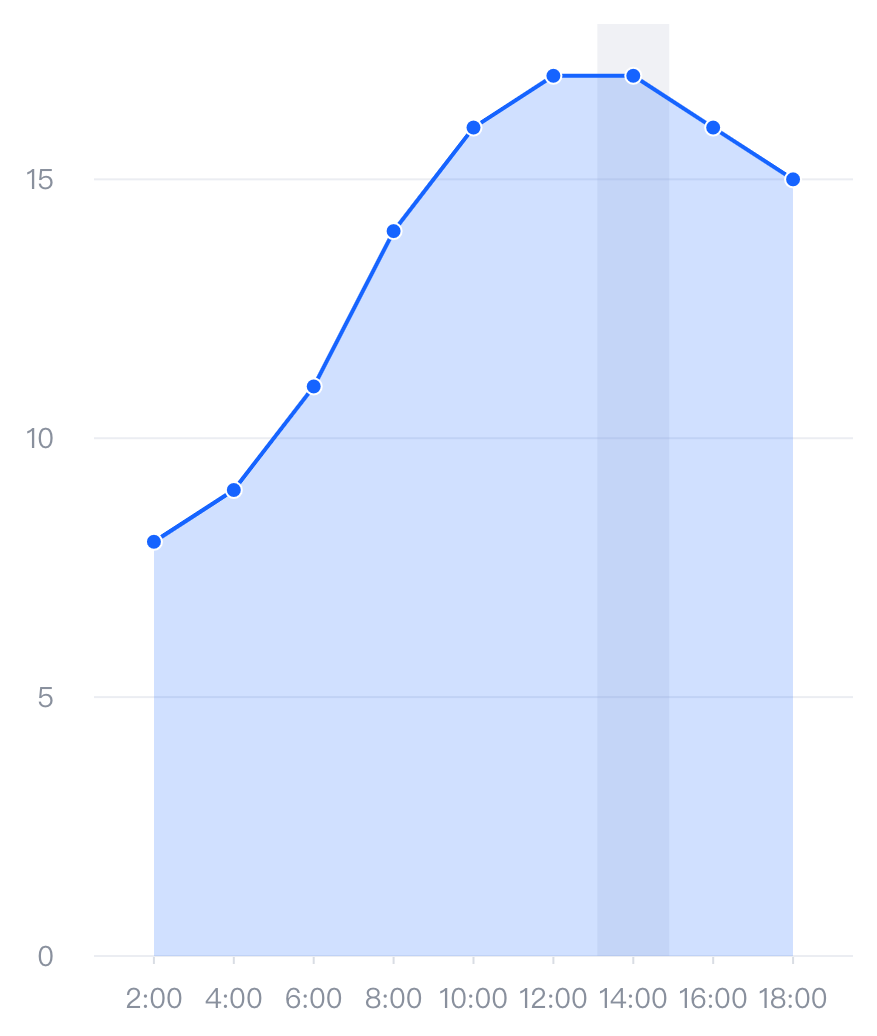
Area Chart
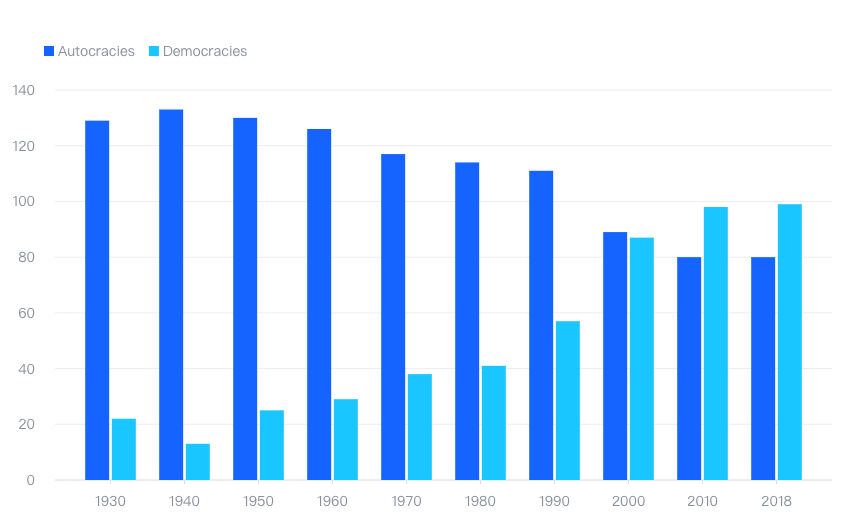
Bar Chart
Funnel Chart

Stream Graph

Sankey Chart

Rose Chart

They all use
VisActor
 Volcano Engine
 Lark
Lark Tiktok
 Capcut
 Medium
 Observable
 Discord