Growth Volatility and Economic Growth in Brazil
 Jorge Arbache
2018, Oxford University Press eBooks
Sign up for access to the world's latest research
Abstract
One of the most puzzling evidences of Brazil's economic performance is that, despite the country's ability to grow at high rates, its long-term growth has been disappointing. Behind this deficient long-term outcome, Brazil shows a high growth volatility. It has experienced substantial growth booms and busts for international standards. These recurrent episodes suggest that the persistent non-realization of Brazil's long-term growth potential and the mechanism by which growth has been systematically constrained are associated to the high volatility that the economy has exhibited over decades. The purpose of this paper is to provide an analysis of growth volatility and its impact on Brazil's growth performance and long-term trajectory. We present and discuss some of the critical issues and main patterns of Brazil's economic growth that are associated to growth volatility. Particular attention is given to its long-term underperformance, its macroeconomic regularities and possible causes and implications of its limited growth potential and degree of international convergence. It does so from a historical perspective and from an international perspective, as the case of Brazil is not only relevant per se, but also representative of many emerging economies, particularly in Latin America.
Figures (14)


Introduction
One of the most puzzling evidences of Brazil's economic performance is that, despite the country's ability to grow at high rates, its long-term growth has been disappointing. Between 1960 and 2015, per capita income grew by 2.25% per year, a relatively low figure for a major emerging economy. The country's per capita income was 29% of the average of high-income countries in 2015, about the same level of that registered in 1960. If, from a long-term viewpoint, Brazil's growth potential has been perceived as formidable (Growth Commission 2008), it is still to realize that potential.
Brazil has confronted significant challenges to promote its economic and social development and has not yet established a robust path of high potential growth. In fact, it is still facing some old challenges in the processes of overcoming the "middle-income trap" (Im and Rosenblatt 2013) and in catching up with high-income countries. At the same time, it has been confronted with new challenges such as globalization, the digital economy and the fast ageing population.
Behind this deficient long-term outcome, Brazil shows a high growth volatility. It has experienced substantial growth booms and busts for international standards. Even the spectacular "economic miracle" (1967)(1968)(1969)(1970)(1971)(1972)(1973)(1974) was followed by a long recession in 1980s, which rendered the economy more prone to macroeconomic instability. Growth acceleration and collapses have constrained the overall long-term performance and impaired the country's trajectory of convergence to the income frontier. Recently, a significant boom-bust episode has been registered and the economy is still in a long process of economic recovery.
These recurrent episodes suggest that the persistent non-realization of Brazil's long-term growth potential and the mechanism by which growth has been systematically constrained are associated to the high volatility that the economy has exhibited over decades. As the crosscountry empirical evidence suggests, high growth volatility is not necessarily neutral and may be associated with low average growth rates (Ramey and Ramey 1995, Easterly at all 2000, Dabusinkas et all 2012, Arbache and Page 2007. Both microeconomic and macroeconomic reasons for that abound, including shortsighted behavior, uncertainty, risk aversion, investment discouragement, financial restrictions, and fiscal and current account imbalances. Such factors can have direct negative effects on growth and its volatility. They can also have protracted adverse effects, including by asymmetric impacts on economic and social variables over booms and bursts. Therefore, growth volatility can be a critical aspect behind Brazil's poor growth performance.
The purpose of this chapter is to provide an analysis of growth volatility and its impact on Brazil's growth performance and long-term trajectory. To the best of our knowledge, this topic has not yet been addressed in the literature. Instead, most systematic analyses have concentrated on the determinants of growth overtime using standard models and growth accounting techniques. 2 In this chapter, we present and discuss some of the critical issues and main patterns of Brazil's economic growth that are associated to growth volatility. Particular attention is given to its long-term underperformance, its macroeconomic regularities and possible causes and implications of its limited growth potential and degree of international convergence.
It does so from a historical perspective and from an international perspective, as the case of Brazil is not only relevant per se, but also representative of many emerging economies, particularly in Latin America. The chapter so proceeds using two data sets for Brazil's GDP per capita: the World Bank`s World Development Indicators (WDI) from 1960 to 2015; and authors' calculations based on the Brazilian Institute of Geography and Statistics` (IBGE) series for GDP and population from 1900 to 2015. 3 The former indicators allow international analysis of Brazil's convergence and growth volatility, while the latter assures a longer-term analysis of Brazil's growth trajectory and empirical features with regard to growth volatility. This chapter is organized as follows: session 2 shows the underperformance of Brazil's convergence with the international frontier, with very limited catching up observed from 1960 to 2015. Session 3 discusses the country's declining growth potential from a longer-term perspective using data from 1901 to 2015. Session 4 focuses on the non-neutrality of Brazil's high growth volatility over this centennial long period, with acceleration cycles being preceded or accompanied by declining growth volatility. Session 5 illustrates such asymmetric effects, contrasting acceleration and collapse episodes by the means of alternative simulations. Session 6 concentrates on the asymmetric effects of volatility, through which growth collapses further aggravate the long-term growth trajectory. Session 7 indicates the performance of economic variables over acceleration and collapses episodes, giving additional evidence of the non-neutrality and of the asymmetric impact of growth volatility. Session 8 discusses the economic mechanisms and underlying causes of growth volatility. Session 9 concludes, pointing out to the need of promoting a set of macroeconomic and structural policies that render growth dynamics not only stronger but also less volatile.
Is Brazil catching up?
A key question to be posed is whether Brazil has managed to or is in the process to converge with developed countries in terms of per capita income. As economic theory indicates (Solow 1956;Barro and Sala-i-Martin 2003), not only per capita income tend to grow over time thanks to technological progress, but also less developed countries are expected to catch up with countries that are ator closer to -the world's frontiers of knowledge and technologies. The latter can grow relatively faster than more advanced economies while displaying higher returns of capital. They tend to converge by attracting international flows of capital and benefiting from international knowledge diffusion and technology spillovers.
However, as many experiences show, catching up can be a hard task. For several reasons, the process of convergence to leading economies can be partial or conditional on a set of complex requirements, as extensively discussed in the empirical literature (Barro 2015). Many underlying economic and non-economic factors that distinguish countries' institutions, structures and economic dynamism, besides a set of initial conditions, interfere with countries' economic growth and convergence rates (Acemoglu et all 2005, Lucas 1990. Therefore, international convergence in per capita income is not necessarily warranted. Actually, this measure has become increasingly spread and unequal across countries (Milanovic 2016). Despite the cases of countries that exhibit considerable degree of convergence, such as Japan and the so-called Asian Tigers (Hong Kong, Singapore, South Korea and Taiwan), most developing and emerging countries in Asia, Africa and Latin America have not yet registered significant changes towards such higher degrees of convergence. A few cases of fast growing economies in recent history, namely led by China, 4 remain promising, but still have to overcome the test of the middle-income trap (Arias and Wen 2015). In fact, some developing and emerging economies that experienced important episodes of rapid economic growth in their history have not yet moved towards a convergence trajectory. To eventually achieve it, they still need to get closer to sustained growth and persistence in both capital accumulation and technological. This is the case of Brazil.
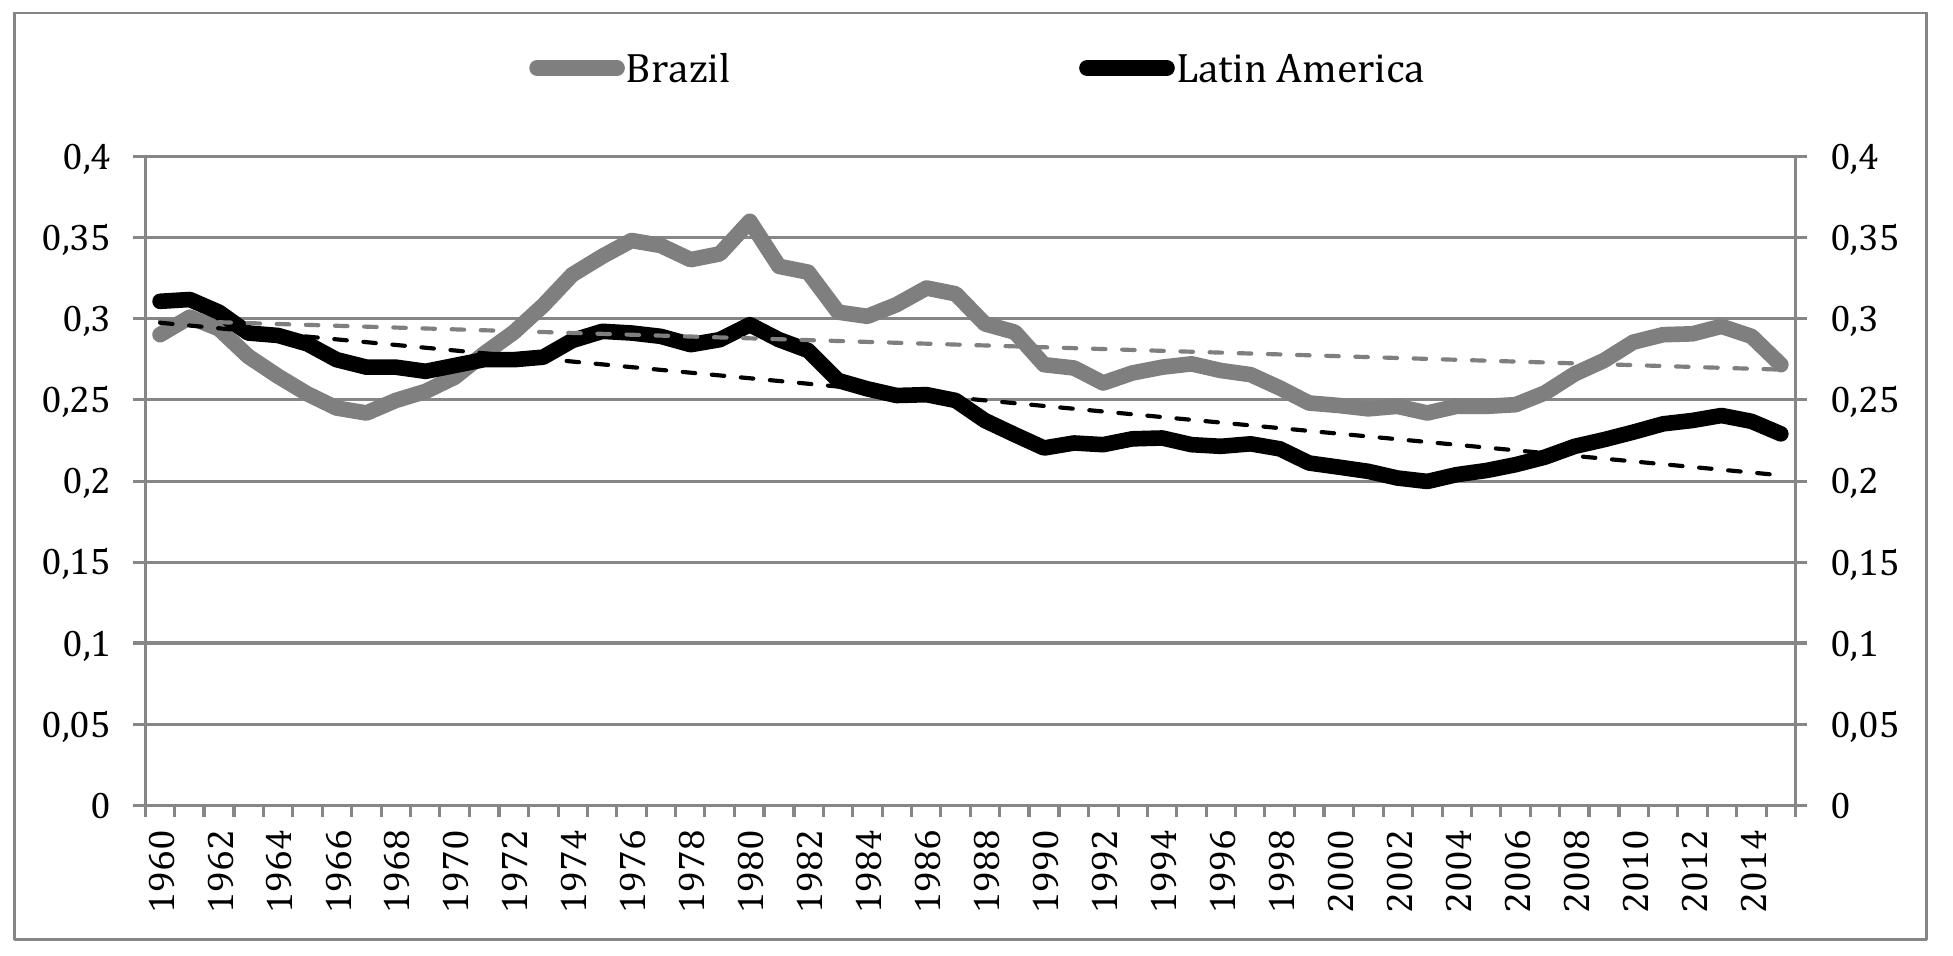
As Figure 1 shows, Brazil's convergence of GDP per capita with the group of high-income countries has not been sustained from 1960 to 2015. 5 In 1960, Brazil's GDP per capita was equivalent to 31% the group's level. After a decline in the beginning of 1960s, Brazil succeeded in accelerating convergence from the mid-1960s until the late 1970s. The peak was achieved at per capita income ratio around 36% over the second half of the 1970s. Since then, Brazil exhibited a declining or stagnant trend. The ratio fell to 25% in the transition from the 20 th to the 21 st century and more recently recovered to about the same level of the beginning of the 1960s.
Figure 1
Ratios of Brazil`s and Latin America's per capita income to high-income countries'
Despite important high growth over past decades, Brazil has not consolidated a long-term convergence to effectively climb the economic ladder. The Brazilian stagnant or nonconvergent trend indicates the presence of underlying economic constraints to grow faster than the frontier and to catch up with it.
Furthermore, over the same period, as depicted in Figure 2, Brazil has also exhibited a declining trend in relation to peers among upper middle-income countries. The average per capita income of the latter group has considerably expanded in the last decades. The group's average has caught up with Brazil: from a ratio close to 3 in the beginning of the 1980s to around 1.5 in 2015. Such a move largely derives from the high and sustained growth rates found in China and other Asian middle-income countries over the recent decades. Some of these countries have found at least conditional convergence to Brazil, which can be regarded as a leader within the group, and are set to challenge the middle-income trap.
Figure 2
Ratios of Brazil`s and Latin America's per capita income to upper middle income countries' Data source: WDI; authors' calculations.
Latin American countries share Brazil's non-convergent pattern to a considerable extent. The region's average ratio of per capita income over time also exhibits declining trends vis-à-vis both the frontier and peer countries. The negative trend appears to be stronger than in Brazil and the implications are at least as worrisome for many of the countries in the region alike. 1960 1962 1964 1966 1968 1970 1972 1974 1976 1978 1980 1982 1984 1986 1988 1990 1992 1994 1996 1998 2000 2002 2004 2006 2008 2010 2012 2014 Data source: WDI; authors' calculations. In face of such developments, some authors appropriately question the term "middle-income trap" on a theoretical or empirical grounds (Im and Rosenblatt 2013)since it is not clear whether there are definitions of trap and of middle-income that remain consistent and robust over time. However, it is undeniable that Brazil and many middle-income countries, not only in Latin America, but also in Asia and Africa, "have been substantially off-track in recent decades in terms of catching up to either a US standard or a high-income OECD standard", as argued by Im and Rosenblatt (2013). They arrive at that conclusion showing that among 13 major developing countries of those regions, only China exhibited an average growth rate over the 1980-2011 period higher than the required growth rate to catch up to the US or the OECD in 50 years.
Low and declining growth potential
In order to explain Brazil's challenges to converge in relative terms to the highest living standards, we first examine the country's growth performance over time. Today's living standards are the result of successive annual rates of per capita income growth. As stated by Barro and Sala-i-Martin (2003, p.6), "if we want to understand why countries differ dramatically in standards of living (…), we have to understand why countries experience such sharp divergences in long-term growth rates."
For a long time, Brazil has been viewed as a country of promising progress with potentially high rates of returns and growth (Growth Commission 2008). In the beginning of the 20 th century, it was one of the countries in the New World that, like the United States, managed to attract considerable flows of immigrants who came in search of jobs and opportunities and therefore helped to build the country's potential. Thus, Brazil eventually moved into the initial stages of industrialization in the 1930s. This process intensified in the 1950s and was characterised by the accumulation of technologies, physical and human capital brought from abroad (Baer 2010). 1962 1964 1966 1968 1970 1972 1974 1976 1978 1980 1982 1984 1986 1988 1990 1992 1994 1996 1998 2000 2002 2004 2006 2008 2010 2012 2014 Along this industrialization phase, growth accelerated, showing an average upward trend from the 1920s to the 1970s (Table 1). In the transition to the following decades, the economy experienced a succession of foreign shocks in the 1970s and early 1980s, such as the sharp rise in oil prices and in the international interest rates, that took a heavy toll due to the mounting economic vulnerabilities of the country. These vulnerabilities were characterised by poor monetary policy and fiscal management, especially during 1980s and early 1990s, and by procrastination of badly needed reforms (Arbache 2004). In sharp contrast to the latest decades, Brazil underwent a long period of recession and the economy grew on average a mere 0.29% in 1981-2000. Actually, Brazil's trajectory of high growth and of international convergence broke in the transition to the 1980s. Since then, growth has been low or constrained, and the economy has remained distant from its previous convergence path.
Table 1
Building on some positive effects of the reforms and fiscal adjustment initiated in mid-1990s and benefiting from high commodity prices, Brazil`s growth recovered in the beginning of the 21 st century, but at a limited pace, reaching 1.64% in the 2001-2015 period.
In fact, the average annual growth per capita had augmented from 1.47% in 1901-1920 to 3.01% in 1921-1940. Brazil managed to expand at high rates of growth, especially in the three decades following World War II. The average rate attained 3.89% in 1941-1960 and peaked at 4.64% in 1961-1980. This culminated with the so-called "economic miracle", which provided the country with a solid manufacturing base (Baer 2010). As Figure 3 indicates, over that period, besides attaining high levels, growth became also substantially more persistent and less volatile.
Figure 3
Brazil's annual growth of per capita income and its linear trend over time (%) Data source: IBGE and Instituto de Pesquisa Econômica Aplicada (IPEA) and IMF projections for and 2017; authors' calculation based on GDP and population series.
The recent performance of Brazil is certainly deceiving. However, even its long-term growth, which averaged 2.53% over the 1901-2015 period, will not suffice to bring it back to a more promising trajectory of convergence to lead economies over the next decades. Taking into account some realistic degree of convergence, Johansson et all (2013) project that Brazil could grow on average at 3.4% annually from 2011 to 2030 and eventually at a rate of 2.1% annually by 2060. Accordingly, Brazil's GDP per capita as a percentage of US' would increase from about 22% in 2011 to 40% by 2060. Important challenges to close this gap will therefore remain and considerable growth acceleration might be required to produce a faster and more effective process of convergence.
Despite its acceleration from the 1920s to 1970s, Brazil's potential growth rate shows a declining trend over the long-term, as depicted in Figure 3. This statistical result is largely due to the growth brake that interrupted the fast expansion of the 1960s and 1970s. The emergence of the 1980s crises and its negative effects, some of which still persist today, are not an isolated fact in Brazil's economic growth history. On the contrary, they are, to some extent, part of Brazil's inter-temporal dynamics reflecting macroeconomic unbalances and structural weaknesses that manifest in the empirical regularities of Brazil's long-term growth performance.
Overall, Brazil's long-term growth trajectory reveals features that contrast with expected trajectories of high-income countries or countries that, to some extent, are overcoming the middle-income trap. Indeed, Brazil has experienced extraordinary boom cycles that could have eventually resulted in a successful trajectory of rising per capita income. However, most of the advancement in terms of grater convergence brought about by boom cycles were eventually faded in downturns. Despite its contribution to Brazil's growth, the high and strong growth persistence of the economic miracle remains a special context in the country's economic history. Over the long-term, as registered more recently, Brazil has undergone sufficiently severe burst cycles to jeopardize the accumulative process of growth.
High growth volatility
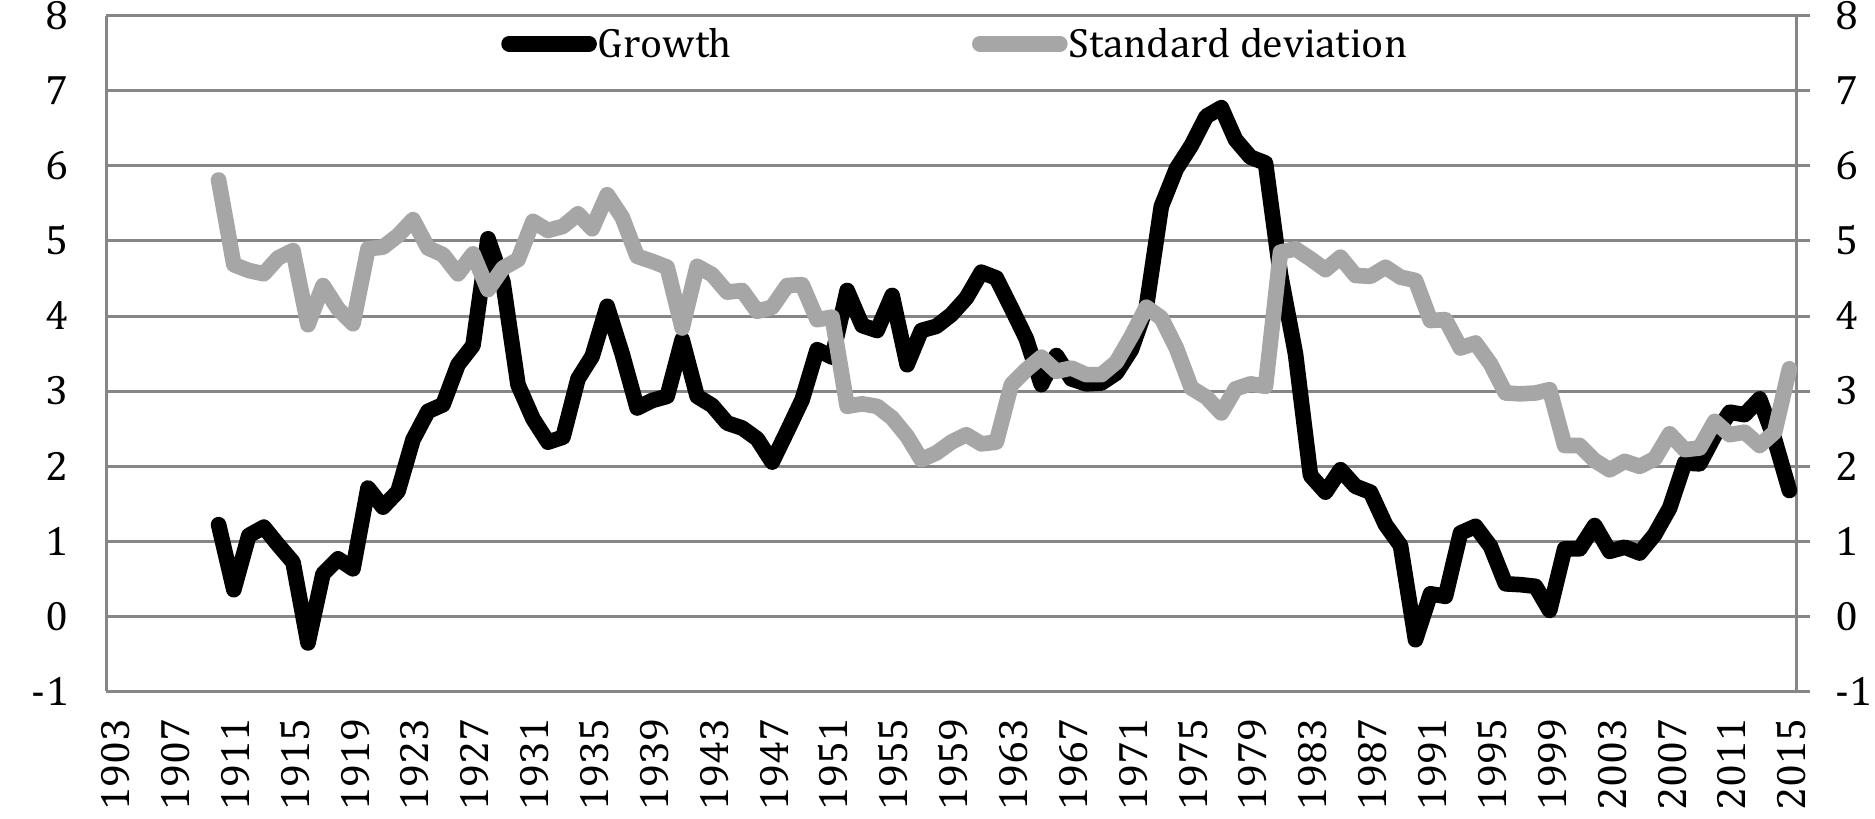
A key feature of Brazil's growth trajectory is the excessive and continuous volatility of its growth rates. The volatility of growth can be measured by the standard deviation of annual per capita income growth rate over a period. It can also be defined in relative terms by the coefficient of variation of the growth rate. These measures are shown in Table 1 for Brazil over different periods. Ten-year standard deviation of growth is also depicted in Figure 4, joint with 10-year moving averages of growth, which depicts the 10-year moving average of growth and the 10-year standard deviation of growth from 1901 to 2015. 1901 1904 1907 1910 1913 1916 1919 1922 1925 1928 1931 1934 1937 1940 1943 1946 1949 1952 1955 1958 1961 1964 1967 1970 1973 1976 1979 1982 1985 1988 1991 1994 1997 2000 2003 2006 2009 2012 2015 Annual growth Trend of annual growth Data source: Instituto de Pesquisa Econômica Aplicada (IPEA), authors' calculation.
Figure 4
Brazil's backward 10-year moving average growth and standard deviation (
As one can observe, Brazil managed to accelerate its economic growth from the 1920s to 1970s, while also reducing the standard deviation of growth, especially if measured in relative terms. 6 Over this period, the negative correlation between growth and its volatility is even more clear when the latter is measured by the coefficient of variation. The economic miracle culminates in both the highest rates of economic growth and the lowest levels of growth variability. As mentioned before, this context was special as it featured strong persistence of economic activity, not only during the upward trend to 1976, but also along downward since then. Brazil's average rate of growth is higher than Latin America's mean rate, but lower than the G20's. At the same time, the volatility of growth in Brazil is lower than in Latin America on average, both in terms of standard deviation and of the coefficient of variation. Despite displaying a lower average growth than the G20's, Brazil has a higher growth variability as measured by the standard deviation. 8 The contrasts between Brazil and other Latin American countries, inside or outside the G20, on the one hand, and Asian emerging economies, on the other hand, are also consistent with the suggested negative correlation between growth volatility and performance. China, India, Indonesia and Korea have all registered higher 1903 1907 1911 1915 1919 1923 1927 1931 1935 1939 1943 1947 1951 1955 1959 1963 1967 1971 1975 1979 1983 1987 1991 1995 1999 2003 2007 2011 2015 Growth Standard deviation growth rates and lower volatility than Brazil, and therefore much lower coefficients of variation. .02 Data source: WDI; authors' calculations. Note: G20 here comprises its 19 member countries, not accounting therefore for the EU. The G20 statistics refer to the average statistics for these countries, while the line above excludes Brazil.
Indeed, one of the most remarkable features of Brazilian growth has been its economic instability. Due to various factors and channels, economic instability generates growth volatility. Such volatility results from and aggravates the variability of aggregates, notably consumption, savings, investments and exports. The high level of variability of GDP growth and its components are a common feature of developing and emerging countries in general (Agenor et all 1999), but of Africa and Latin America in particular Page 2007, 2015;Arbache et al 2010).
The underperformance of Brazil as given by the coefficient of variation has been especially severe since the 1980s. In comparison to other G20 countries, high volatility appears to be one determinant factor behind the very low growth experienced since then. Despite the significant improvement brought about by stabilization programs since the 1990s, Brazil's performance remained below the G20's average and characterised by excessive growth variability. The negative relationship between volatility and growth can be better examined in the Figure 4. The 10-year growth peak in 1976 coincides with one of the troughs in volatility. Similar correlations between low volatility and higher growth are found over the 1950s and the beginning of the 21 st century. In addition, the high standard deviations coexist with low growth rates, particularly during 1980s, at the beginning of the 20 th century, and in the more recent slowing down of the economy.
Volatility and growth simulations
In order to explore further the impacts of volatility in growth performance, we simulate what would have happened to Brazil's trajectory under alternative growth scenarios. The scenarios rely on assumptions that the economy could have grown closer to its long term avoiding excessive high and/or low rates of growth in some years. Table 4 presents the simulations using both data series employed in earlier sessions, covering the periods 1901-2015 (IBGE) and 1961-2015 (WDI).
Table 4
Simulating the average long-term growth rate under different conditions (%),1901- 2015 and 1960-2015
In simulation 1, we substitute the average long-term growth rate (average rate) for years where the actual growth rate was below the average rate minus one standard deviation, i.e., we replaced the worst growth years with the long-term growth rate. As a result, the long-term growth rate would have been about 1 percentage point higher.
In simulation 2, we substitute the average long-term growth rate for years where the actual growth rate was above the average rate plus one standard deviation, i.e., we replaced the best growth years with the long-term growth rate. As a result, the long-term growth rate would have been close to 1 percentage point lower.
In simulation 3, we substitute the average long-term growth rate for years where both the actual growth rate was below or above the average rate minus / plus one standard deviation, i.e., we replaced the worst / best growth years with the long-term growth rate. As a result, the long-term growth rate would have been close to the actual average rate. Notes: standard deviations in parentheses (); and differences to actual average rates in (()) Source: authors' calculations.
These exercises demonstrate that the excessive volatility induced by both high and low growth rates have indeed very considerable impacts on growth performance. It suffices to note that the differences of average rates between simulations 1 and 2 are about 2 percentage points, which is close to the actual long-term average rates for the two used series.
Moreover, we can start to explore the asymmetric effects of volatility. Despite a rough equivalence of average growth rates between simulation 3 and the actual growth trajectory, 9 especially from the 1901-2015 period, the higher the volatility and the longer its duration, the greater are the negative accumulative effects in per capita income.
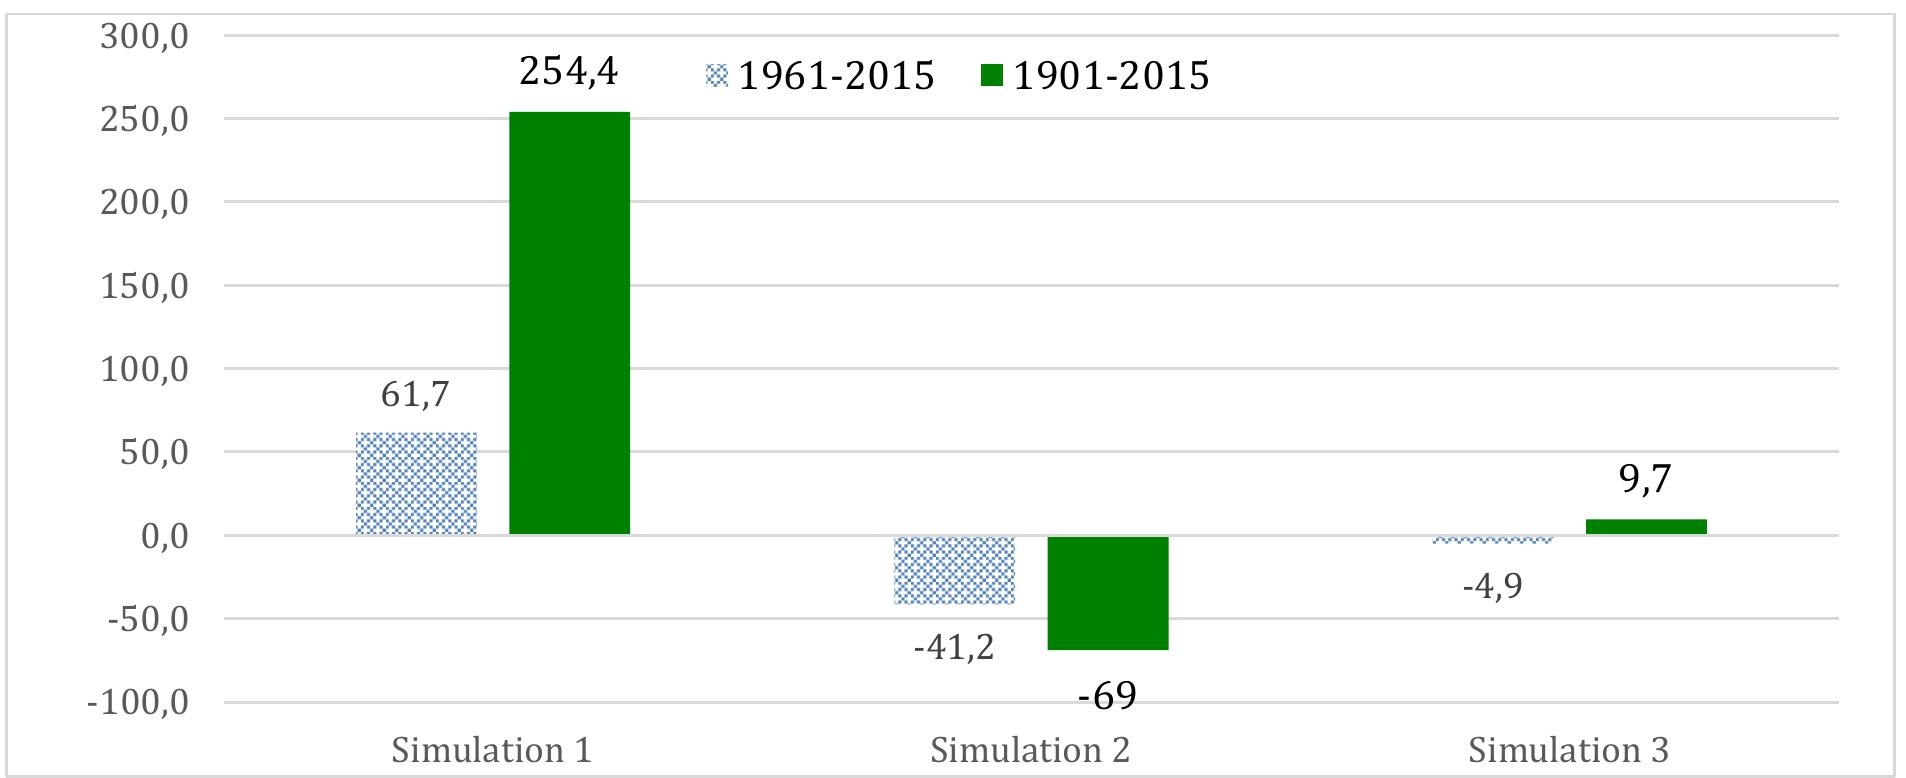
These arguments are more clearly summarized in Figure 5, which depicts the overall impacts of the simulations in Table 4 on the per capita income over the long term. Had the economy avoided the low growth rates over the period 1961-2015, the income would have been 61.7% higher in 2015. Over the longer period, starting in 1901, the per capita income would have grown to a level 254% higher in 2015. This would have led Brazil to the group of high income countries, at a level just 4% below the group's average. Figure 5 also shows that, had the economy missed the high growth rates from 1961, the income would have been 41.2% lower than the actual one observed in 2015. Accounting the accumulative impact since 1901, the level would have been 69% lower in 2015.
Figure 5
Per capita GDP in 2015 under different growth simulations from 1961 and from 1901: gap with actual data (%) Note: Growth conditions as in
Finally, had the economy avoided both extreme rates, the per capita income would have been closer to the actual figure. The discrepancies depend eventually on the sample period. However, overall, given the size of the non-realized income in simulations 1, inferior rates of growth are substantially more harmful to the economy than the benefits of superior rates of growth. Table 4; each simulation reflects results using the 1961-2015 and 1901-2015 series in order. Source: authors' calculations. Figure 6 compares the per capita income under the actual growth trajectory -the baselineand alternative per capita income trajectories as given by simulations 1-3. The income gap in 2015 between the baseline and simulations 1 and 2 can mostly be accounted for by the growth acceleration that took place until 1980, especially during the "economic miracle" years, and the collapse of growth rates since then. That explains the similarity between baseline and simulation 1 trajectories, as well as the discrepancy baseline and simulation 2 trajectories, at 9 A feature that is due to growth rates being normally distributed, especially for longer series, whose trend can be accounted for. least up to 1980; and the greater divergence between baseline and simulation 1 trajectories, as well as the greater convergence between baseline and simulation 2 trajectories since 1980. While the incidence of growth expansions had been greater before 1980, the incidence of growth contractions augmented substantially after 1980. Note: simulations as in Table 4; comparison with the actual per capita income trajectory. Source: authors' calculations. Figure 7 shows the decadal incidence of years where actual annual growth was above longterm growth. The upward trend was discontinued in the 1980s. Since then, the incidence has been kept at much lower levels, suggesting again that potential growth has receded in the latest decades. Actually, the latest decades have been strongly associated to growth volatility, and such a historical downward shift points out once more to the relevance of growth volatility to growth potential. 1960 1962 1964 1966 1968 1970 1972 1974 1976 1978 1980 1982 1984 1986 1988 1990 1992 1994 1996 1998 2000 2002 2004 2006 2008 In this session, we focus on specific episodes of growth acceleration and growth collapses. While volatility constrains long-term growth, including by asymmetric effects of expansions and contractions, acceleration and collapse episodes can change more dramatically the growth trajectory, inflicting persistent shifts over and beyond typical or regular cycles. These episodes magnify high growth volatility, which has adverse consequences to parameter stability in regression models and economic analysis, especially at low growth periods (Pritchett 2000;Hausmann, Pritchett and Rodrik 2005;Johnson, Ostry and Subramanian 2007;Arbache and Page 2007; inter alia). 10 Growth episode analyses in those circumstances are advisable to identify substantially different behavior beyond the expected cyclical trend and regularities.
Figure 6
Simulated trajectories of per capita income under different growth scenarios ($), 1961-2015
Figure 7
Incidence of years with actual growth above long-term growth, 1901-2015 (%) Source: authors' calculations.
In order to examine growth acceleration and collapses, we design and employ a methodology to identify episodes of growth accelerations and collapses, similar to the methodology developed by Arbache and Page (2007). 11 The episodes of accelerations and collapses are defined in two steps: the reference and remaining years. The reference years are at least 3 years in a row in which two conditions are observed for every year: (a) the annual growth is higher the long term average growth; and (b) the forward 4-year moving average growth rate is higher than the backward 4-year moving average. The remaining years are those years in a row, immediately after the reference years, in which condition (a) holds.
Following this methodology, using the 1965-2015 series, we only find one acceleration episode for Brazil. It consists of 7 consecutive years, from 1968 to 1974 (reference years 1968-1971). 12 Since then there are three collapse episodes comprising in total 14 years: from 1987 to 1992 (reference 1987-1989); from 1996 to 1999 (reference 1996-1998); and from 2012-2015 (reference 2012-2015).
When using the 1901-2015 series, the same results are found for the period starting in 1961. 13 Additionally, the 1996-1999 collapse turns to be two years longer, encompassing the period from 1996 to 2001. We also identify two previous growth acceleration episodes before 1961 in total encompassing 9 years: from 1932 to 1934 (reference 1932-1934) and from 1957 to 1962 (reference 1957-1959).
Overall over 115 years since 1901, Brazil has experienced 3 growth acceleration episodes totaling 16 years, and 3 growth collapses also amounting 16 years. Figure 8 compares Brazil's average growth rates during these various episodes. The acceleration phases considerably exceed average growth by 4 to 6 percentage points, while collapses were 3
Figure 8
Average growth rates during episodes of growth acceleration and collapse (%),
10 Growth rate volatility is hardly a significant predictor of growth in a single equation framework, even after including the usual control variables. That is due to the potential endogeneities that characterize the relationship between these variables as well as to non-linearities. As both good and bad times push in opposite directions, estimating growth in a standard single equation framework can lead to misleading conclusions. The empirical evidence suggesting no link between output volatility and growth (Solow 1997, Dawson and Stephenson 1997, and Posch and Walde 2011 is at least partly explained by this factor. 11 As in Arbache and Page (2007), there are two merits in this methodology. First, it identifies both growth accelerations and decelerations, thus allowing for a much wider investigation of growth volatility. Second, it endogenizes the country's economic conditions into the method, so that there is no need to impose any parameter to identify growth acceleration and deceleration. In other words, it does not use an exogenous threshold rate to identify growth episodes. Instead, it defines acceleration and deceleration relative to the country's long run economic performance.
12 Despite the growth rates for 1975 and 1976 being higher than the historical average, we do not include them due to condition (b), which holds up to 1971.
13 Both 1961-2015 and 1901-2015 series deliver the same episodes, namely the same reference years, since 1961. These results are also robust for the use of a linear trend, instead of a historical average, and for the change in the window of the moving average as defined in condition (b). We tested the window for 3 and 5-year, in place of 4-year moving average. percentage points below the long term mean. Even more noteworthy, the gap between acceleration and collapse episodes are close to 7 percentage points over the 1901-2015 period. For the 1901-2015, the excessive growth of the acceleration episodes vis-à-vis the long-term trend represents about 47% gain in GDP per capita. The three collapse episodes, however, sum up to a loss of 206% in GDP per capita relative to the long-term trend up to 2015.
The various acceleration and collapse episodes expose further the economy to a highly bumpy, low persistent growth trajectory. Collapses curtail aggregate demand and particularly capital accumulation in a more severe way than regular business cycles downturns. They generate deeper and longer recessions, augment (long-term) unemployment through hysteresis effects and erode the hard to sustain conditions that stimulate innovation and formation of skilled labor. Growth volatility is eventually exacerbated and growth performance tend to be further restricted. 1961-2015 and 1901-2015 Note: Growth conditions as in Table 4; each simulation reflects results using the 1961-2015 and 1901-2015 series in order. Data source: WDI; authors' calculation based on the methodology of Arbache and Page (2007).
The asymmetric relationship between growth volatility and other variables
The non-neutrality of growth volatility manifests through different economic and financial variables and channels. Table 5 presents the actual figures of a selection of key indicators during growth accelerations and growth collapses, as defined in the previous section using the 1961-2015 GDP per capita series. 14 Total factor productivity (TFP) has grown on average at low rates in Brazil and constitute perhaps the one of the sources of the GDP per capita gap between Brazil and OECD countries (Johansson et all 2013). It expands at much higher rates during the acceleration period and falls over collapses. The same applies to investments, which responds even more strongly to the acceleration episode. Actually, there seems to be asymmetric reactions of TFP and investments to acceleration and collapses. While the latter induce the contraction of these variables, growth accelerations amplify their expansion. However, on average from a longterm perspective their growth is limited and insufficient to generate convergence.
Table 5
Means of selected indicators, 1961Means of selected indicators, -2015
Another evidence of the constrained investment dynamics is the higher level of capacity utilization in the acceleration period than those registered on average or during collapses. As discussed by Bacha and Bonelli (2016), the adjustments in capacity utilization over expansions and contractions reflect such a dynamics, coupled with the productivity of capital.
The current account deficit is higher over growth acceleration as consumption and especially investment expand at much higher rate. In contrast, over collapses the current account balance tends to shift upward as part of the exchange rate and balance of payment adjustments associated to the growth cycles of an internationally credit constrained economy (Sarquis 2009).
The stock of domestic credit as ratios to GDP tend to augment during collapses, as a sign of excessive debt leverage and domestic consumption smoothing. Certainly, however, in recent decades Brazil has undergone, besides some degree of greater trade and financial openness, considerable financial deepening. The latter can partially explain a higher credit ratio to GDP in collapses, which took place after the long acceleration period. Nevertheless, the results are robust to the consideration of trend in financial deepening. As discussed in Easterly et all (2000), financial deepening might have ambiguous or non-linear effects on growth volatility. It might, on the one hand, strength the ability to respond to shocks and, on the other hand, exacerbate exposure to financial shocks. A similar analysis apply to trade and financial openness, which might contribute to risk diversification, whilst rendering the economy more volatile as it becomes more responsive to foreign demand and credit shocks. Actually, debt accumulation in foreign and domestic markets is an issue that pertain both openness and financial deepening.
Unemployment, poverty and income inequality typically also have unbalanced responses during episodes. They tend to deteriorate disproportionately more during collapses than they improve during the good times. So, avoiding growth collapses seems to be far more effective for poverty alleviation than supporting growth acceleration.
Of course, there are other specific reasons explaining the responses of each indicator during different growth circumstances. Whatever the reasons, the analysis tend to suggest that growth volatility is indeed non-neutral to other key variables that might determine and restrict the growth performance. Contractions and collapses can have persistently adverse effects, rendering their overall impact particularly asymmetric and detrimental to long term GDP, despite the mostly temporary benefits of expansions and accelerations. Notes: Unilateral T-tests suggest that the aacceleration and collapse means above either are unequal or differ from the overall mean, always at the 5% significance level, except in some cases, as indicated, at 10% (*) or 20% (**) significance levels.
The workings of growth volatility and the factors behind it
Ever since Ramey and Ramey (1995) proposed a causal relationship between growth ant its volatility, the literature has found both negative and positive effects from volatility on growth (see Dopke 2004 for a summary). When analyzed either over its own long term trajectory or in contrast to advanced countries and emerging and developing economies, namely in Asia, the case of Brazil tends to show more evidence in favor of adverse effects of volatility on growth. The workings of these phenomena and their causes can be viewed from both microeconomic and macroeconomic perspectives.
It is clear, from the Brazilian experience, that volatility reduces economic predictability, generates ambiguous signals, and therefore reduces the appetite for long-term return investment. It precipitates shortsighted behavior, excessive debt leverage and thus increase uncertainties, risk-aversion and financing costs. All these factors are detrimental to sustained investments and to long-term projects, particularly those intensive in innovation and human capital (Aghion et all 2010). Volatility therefore not only lowers growth but also induces changes in the economic structure that might further magnify volatility pressures. The case of Brazil is illustrative of these mechanisms, to the extent that the economy relied on low investments and increasingly on investments in more oligopolized or monopolized businesses, and in commodities and semi-manufactured goods that are excessively volatile.
Besides curtailing investment dynamics, high volatility affects savings and brings further constraints to such dynamics and, therefore, to high and sustained growth. It brings instability to monetary and fiscal policy, as well as to financial markets. This manifests in pressures over domestic interest rates, higher premium of longer-term credit and of foreign credit risks. All these financial costs, including term spreads and risk premia respond intensively to domestic and international shocks and through financial accelerator mechanisms render investment and the economic activity overall more volatile, as discussed for Brazil in Sarquis (2009). Moreover, shifts in this risk-perception are associated to exchange rate movements and to drastic changes in the current account. Through all these mechanisms, the economy becomes sensitive for instance to cyclical gains of exports of commodities and semi-manufactured goods or to excessive capital flows, via the concentration of foreign investments in M&A, portfolio investments, and public services such as energy and telecom.
Furthermore, as observed in the Brazilian case, political economy mechanisms come into play. Volatility encourages firms and people to turn to the public sector for security, including the search for public jobs, tax breaks and other forms of demands, such as public services and public goods, which end up in larger government sizes, government interventions and fiscal burden (Rodrik 1998, Jetter et all 2013. As more resources are withdrew from the private sector, it can in turn lower growth rates at least in the short run (Barro and Lee 1994, Barro 2001, Afonso and Furceri 2010, Afonso and Castro 2016 Trapped in an upper middle income trap, Brazil has been entrenched in a growth dynamics that has become more volatile and weaker over time. It has suffered from the interplays of low savings and investment rates, as much as from low productivity and high costs of financing and production factors. As Bacha and Bonelli (2004) document, low rates of investment in Brazil result not only from low savings, but also by high cost of capital, which was historically induced by the import substitution industrialization strategy and by lack of trade openness.
Growth volatility, as manifested in acute crises of various sorts (such as balance of payment, fiscal, currency or monetary crises), is not merely a symptom of an unbalanced growth trajectory. It reflects underlying macroeconomic and structural weaknesses that severely restrict growth, impeding sustained moderate to high rates that would assure convergence.
Brazil as many other developing and emerging economies, Brazil is confronted with different macroeconomic and structural weaknesses. A good number of these pertain to domestic and foreign credit constraints (Cabalero and Krishnamurthy 2001), which restrict investments, rendering them and economic activity more volatile and eventually curbing mean growth Banerjee 2005, Aghion et all 2010).
The major trigger of the tightening of domestic constraints in Brazil reside in fiscal imbalances. 16 By aggravating uncertainties and financing costs, fiscal imbalances augment volatility and restrict and discontinue public and private investments. For instance, Adrogué et all (2006) emphasize the workings of high level of government consumption that imposes high real interest rates, lowering investment and growth. Such fiscal imbalances and the volatility it generates also interfere in debt maturity and the term structure not only of the public debt but also in the formation of long term financial and credit markets that are key to sustained growth and development.
As Blanchard (2005) argues fiscal dominance can be so entrenched that, within the inflation target regime, the necessary tightening of interest rates in view of inflation pressures can lead to adverse effects both in terms of debt sustainability and real depreciation. This situation conforms especially for high levels of debt, of foreign-currency-denominated debt and of risk premia, and monetary policy responses further amplifies volatility and its negative effects on investment dynamics. In open economies, pressures of this kind can be particularly severe.
International financial openness, as much as trade openness, might in principle provide a mechanism by which a country could diversify risks and smooth shocks. However, at the same time, openness could expose it to greater volatility, as exogenous shifts terms of trade and in capital flows can through foreign (credit) and domestic (monetary and fiscal) constraints further disrupt economic activity (Easterly et all 2000). The patterns of trade and financial integration matter and therefore countries respond differently to more or less integration.
Sarquis (2011) also suggests that the sequencing of trade and financial integration help understand different performance of some Asian and Latin American countries, as they oriented their strategies differently in this regard. While Asia has focused more on trade-led growth strategies, Latin America concentrated on strategies that were inevitably dependent on international finance (Agenor et all 1999). Despite remaining less open to trade and international finance than advanced economies, Asia and Latin America developed different sequencings of openness. The former have focused on trade from the start, and have managed to develop an export-led growth strategy that implies savings generation. Latin American economies, on the contrary, have concentrated in gaining access to international finance, and through an import substitution strategy have become more dependent on external savings and more exposed to growth volatility
In the case of Brazil, which could be regarded as a constrained capital import-led growth (Sarquis 2011), severe foreign constraints are still reflected in often persistent current account deficits and high country risk premia. Also, they interplay with domestic constraints, which manifest in low savings, unsettle public debt dynamics and high real interest rates. Brazil only managed to revert some of these negative features temporarily, for instance exhibiting surpluses in the current account merely over a couple of years, due to favourable commodity prices and terms of trade.
Stylized facts have shown that commodities prices are extremely volatile and highly subject to public and even private interventions. Empirical evidence shows that countries such as Brazil, that are dependent on commodities exports, have a slower long-term economic growth rate compared with countries with more diversified exports. 17 Export diversification can lead to more persistent trade gains, while also minimizing adverse impacts arising from the volatility of commodity prices and exports (Loayza, Servén andVentura 2007, Cavalcanti, Mohaddes andRaissi 2014). 18 As shown by Maloney (2007, 2008), it is not the exports of primary goods itself but rather the low degree of export diversification that is associated with a low growth rate. Arbache and Page (2007) stress that countries which are most dependent on commodities exports, despite being able to accelerate growth for a while, eventually experience strong collapses, meaning that in the long run average growth is low. They also show that the terms of trade are among the main causes of these acceleration and collapse growth episodes. Cardoso and Teles (2010) document that the fluctuations of Brazilian products around the potential GDP growth between 1900 and 2008 are strongly associated with shocks in the terms of trade.
Commodity exports can serve to alleviate the external financing constraint by improving the trade balance and moderating current account deficits. In Brazil, this has been mostly evident in the trade balance with China, which emerged as Brazil's major trading partner over the last decades. However, it must be noted that besides adding additional instability due to its excessive volatile nature in international markets in terms of both quantity (demand) and prices, the recent commodity expansion in Brazil has been accompanied by premature deindustrialization and servicification -as given by the fall of the share of manufacturing in GDP in 2015 from 34% in mid-1980s to 10% and by the very high and increasing share of services in GDP at about 74%. These processes have geared the economy towards a concentration in mostly low-tech, low-productivity, final consumption services, and suggest that Brazil is undertaking a kind of a "reverse structural change" (Arbache 2016). That helps to explain the stagnated productivity, relatively low and decreasing industrial densities (Arbache 2012(Arbache , 2016, low indices of intra-industry trade with some of Brazil's most important partners (Sarquis 2011), and the poor participation of Brazil in global value chains.
In many ways, industrialization, trade openness and trade composition can have important implications for moderating Brazil's volatility and enhancing its long-term strategy. In the case of Brazil, Sarquis (2011) presents evidence that the expansion of manufacture export, namely machine and equipment exports, have been much more growth-inducing than increases in commodity exports. Manufacturing export growth contributes more directly to capital accumulation and to other growth factors, such as technological adaptation and diffusion. They also tend to be more persistent and less volatile.
Conclusions
This chapter shows that growth is extremely volatile in Brazil and that growth volatility has had considerable impacts on growth potential and performance over the last century. High volatility over and beyond business cycles constrains long-term growth with particularly adverse and asymmetric cumulative effects of growth acceleration and collapse episodes on GDP per capita.
Growth volatility and collapses are both harmful to long-term growth prospects, likely shifting potential growth downwards on a persistent basis. They help explain the underperformance of Brazil's growth and its poor convergence with advanced economies. Such an explanation could be extended to other developing and emerging economies that are still viewed as being in the middle-income trap.
In view of that, the main economic challenge of Brazil is not attaining high rates, but rather growing in a more stable and sustained manner. Other things equal, merely attaining high rates of growth can be shortsighted and misleading, while also inducing economic distortions, unbalanced responses and eventually new sources of volatility.
Economic policies should be geared towards braking the high volatility-low growth vicious circle. Preemptively reducing the risks of growth collapses and moderating contractions are key policy objectives that can per se contribute to enhance growth in the long-term. Such objectives should be part of a policy framework aiming to render the economy more dynamic on more sound, balanced and sustained basis. This framework designed to address the main sources of growth volatility and to promote growth persistence should contemplate and reconcile both macroeconomic and structural policies, addressing the supply and demand sides of the economy.
The way forward requires the establishment of sound fiscal policies at all levels of government. Fiscal discipline should also be made as much consistent as possible with a strategy of public investment for development and with the ability to responsibly respond to adverse shocks to aggregate demand. Monetary and financial policies are key to assure macroeconomic stability, while also determinant to increase the propensity to save and to deepen capital and credit markets, in particular for pension funds and long term investment financing. At the same time, they should better hedge against risks, including of sudden outflows of capital, and improve the competitiveness and inclusiveness of the financial system, with cheaper and more accessible financial services.
Market reforms, trade and investment policies should seek to strengthen and further integrate the Brazilian economy to the world economy, while aiming to diversify the economic structure, domestic markets and international linkages. Internationalization of Brazilian companies, participation in global value chains, and attraction of efficiency-seeking foreign direct investments should be coupled with the development of activities of higher value-added and more knowledge-dependent. In many ways, this agenda can be pushed forward in areas in which Brazil benefits from static and dynamic comparative advantages such as agribusiness, forests, biodiversity, renewable energy, health, aerospace, mining, and ultra-deep oil exploration.
Brazil will have to learn from its lessons and move forward, also facing challenges more typical of advanced economies such as those related to population aging. Moreover, as argued by the Growth Commission (2008), eventually "countries embarking on a high-growth strategy today must overcome some global trends their predecessors did not face" (p. 9). Thanks to its natural base and clean energy matrix, Brazil is well positioned to develop sustainable business and growth and, thus, to give a significant economic contribution to address climate change. However, considerable human capital investment remains to be made to prepare the country to gain from the new sources of growth, which are increasingly driven by the digital economy, the information and communication technologies, and innovation in advanced services and manufacturing.
Table 1