Papers by Hans-Christian Hege

arXiv (Cornell University), Apr 4, 2022
The sensitivity of parameters in computational science problems is difficult to assess, especiall... more The sensitivity of parameters in computational science problems is difficult to assess, especially for algorithms with multiple input parameters and diverse outputs. This work seeks to explore sensitivity analysis in the visualization domain, introducing novel techniques for respective visual analyses of parameter sensitivity in multi-dimensional algorithms. First, the sensitivity analysis background is revisited, highlighting the definition of sensitivity analysis and approaches analyzing global and local sensitivity as well as the differences of sensitivity analysis to the more common uncertainty analysis. We introduce and explore parameter sensitivity using visualization techniques from overviews to details on demand, covering the analysis of all aspects of sensitivity in a prototypical implementation. The respective visualization techniques outline the algorithmic in-and outputs including indications, on how sensitive an input is with regard to the outputs. The detailed sensitivity information is communicated through constellation plots for the exploration of input and output spaces. A matrix view is discussed for localized information on the sensitivity of specific outputs to specific inputs. A 3D view provides the link of the parameter sensitivity to the spatial domain, in which the results of the multi-dimensional algorithms are embedded. The proposed sensitivity analysis techniques are implemented and evaluated in a prototype called Sensitivity Explorer. We show that Sensitivity Explorer reliably identifies the most influential parameters and provides insights into which of the output characteristics these affect as well as to which extent.
Computer Graphics Forum
Our ability to grasp and understand complex phenomena is essentially based on recognizing structu... more Our ability to grasp and understand complex phenomena is essentially based on recognizing structures and relating these to each other. For example, any meteorological description of a weather condition and explanation of its evolution recurs to meteorological structures, such as convection and circulation structures, cloud fields and rain fronts. All of these are spatiotemporal structures, defined by time-dependent patterns in the underlying fields.

Shape in Medical Imaging, 2020
We propose generalizations of the Hotelling's T 2 statistic and the Bhattacharayya distance for d... more We propose generalizations of the Hotelling's T 2 statistic and the Bhattacharayya distance for data taking values in Lie groups. A key feature of the derived measures is that they are compatible with the group structure even for manifolds that do not admit any bi-invariant metric. This property, e.g. assures analysis that does not depend on the reference shape, thus, preventing bias due to arbitrary choices thereof. Furthermore, the generalizations agree with the common definitions for the special case of flat vector spaces guaranteeing consistency. Employing a permutation test setup, we further obtain nonparametric, two-sample testing procedures that themselves are bi-invariant and consistent. We validate our method in group tests revealing significant differences in hippocampal shape between individuals with mild cognitive impairment and normal controls.
This paper presents an algorithm called surfseek for selecting surfaces on the most visible featu... more This paper presents an algorithm called surfseek for selecting surfaces on the most visible features in direct volume rendering (DVR). The algorithm is based on a previously published technique (WYSIWYP) for picking 3D locations in DVR. The new algorithm projects a surface patch on the DVR image, consisting of multiple rays. For each ray the algorithm uses WYSIWYP or a variant of it to find the candidates for the most visible locations along the ray. Using these candidates the algorithm constructs a graph and computes a minimum cut on this graph. The minimum cut represents a very visible but relatively smooth surface. In the last step the selected surface is displayed. We provide examples for the results in real-world dataset as well as in artificially generated datasets.
In this paper we describe VisiTrace, a novel technique to draw 3D lines in 3D volume rendered ima... more In this paper we describe VisiTrace, a novel technique to draw 3D lines in 3D volume rendered images. It allows to draw strokes in the 2D space of the screen to produce 3D lines that run on top or in the center of structures actually visible in the volume rendering. It can handle structures that only shortly occlude the structure that has been visible at the starting point of the stroke and is able to ignore such structures. For this purpose a shortest path algorithm finding the optimal curve in a specially designed graph data structure is employed. We demonstrate the usefulness of the technique by applying it to MRI data from medicine and engineering, and show how the method can be used to mark or analyze structures in the example data sets, and to automatically obtain good views toward the selected structures.
In the recent years the advent of powerful graphics hardware with programmable pixel shaders enab... more In the recent years the advent of powerful graphics hardware with programmable pixel shaders enabled interactive raycasting implementations on low-cost commodity desktop computers. Unlike slice-based volume rendering approaches GPU-assisted raycasting does not suffer from rendering artifacts caused by varying sample distances along different ray-directions or limited frame-buffer precision. It further supports direct implementations of many sophisticated acceleration techniques and lighting models. In this paper we present a GPU-assisted raycasting approach for data that consists of volumetric fields defined on computational grids as well as unstructured point sets. We avoid resampling the point data onto proxy grids by directly encoding the point data in a GPU-octree data structure. This allows to efficiently access the (semitransparent) point data during ray traversal and correctly blend it with the grid data, yielding interactive, highquality rendering results. We discuss approac...
Medical Image Computing and Computer Assisted Intervention – MICCAI 2020, 2020
Intrinsic and parametric regression models are of high interest for the statistical analysis of m... more Intrinsic and parametric regression models are of high interest for the statistical analysis of manifold-valued data such as images and shapes. The standard linear ansatz has been generalized to geodesic regression on manifolds making it possible to analyze dependencies of random variables that spread along generalized straight lines. Nevertheless, in some scenarios, the evolution of the data cannot be modeled adequately by a geodesic. We present a framework for nonlinear regression on manifolds by considering Riemannian splines, whose segments are Bézier curves, as trajectories. Unlike variational formulations that require time-discretization, we take a constructive approach that provides efficient and exact evaluation by virtue of the generalized de Casteljau algorithm. We validate our method in experiments on the reconstruction of periodic motion of the mitral valve as well as the analysis of femoral shape changes during the course of osteoarthritis, endorsing Bézier spline regression as an effective and flexible tool for manifold-valued regression.

Nondestructive Testing and Evaluation, 2020
We present visual methods for the analysis and comparison of the results of curved fibre reconstr... more We present visual methods for the analysis and comparison of the results of curved fibre reconstruction algorithms, i.e., of algorithms extracting characteristics of curved fibres from X-ray computed tomography scans. In this work, we extend previous methods for the analysis and comparison of results of different fibre reconstruction algorithms or parametrisations to the analysis of curved fibres. We propose fibre dissimilarity measures for such curved fibres and apply these to compare multiple results to a specified reference. We further propose visualisation methods to analyse differences between multiple results quantitatively and qualitatively. In two case studies, we show that the presented methods provide valuable insights for advancing and parametrising fibre reconstruction algorithms, and support in improving their results in characterising curved fibres.
Advances in Physics: X, 2018
Comets display with decreasing solar distance an increased emission of gas and dust particles, le... more Comets display with decreasing solar distance an increased emission of gas and dust particles, leading to the formation of the coma and tail. Spacecraft missions provide insight in the temporal and spatial variations of the dust and gas sources located on the cometary nucleus. For the case of comet 67P/Churyumov-Gerasimenko (67P/C-G), the long-term observations from the Rosetta mission point to a homogeneous dust emission across the entire illuminated surface. Despite the homogeneous initial distribution, a collimation in jet-like structures becomes visible. We propose that this observation is linked directly to the complex shape of the nucleus and projects concave topographical features into the dust coma. To test this hypothesis, we put forward a gas-dust description of 67P/C-G, where gravitational and gas forces are accurately determined from the surface mesh and the rotation of the nucleus is fully incorporated. The emerging jet-like structures persist for a wide range of gas-dust interactions and show a dust velocity dependent bending.
IEEE Transactions on Visualization and Computer Graphics, 2019
The analysis and visualization of nucleic acids (RNA and DNA) play an increasingly important role... more The analysis and visualization of nucleic acids (RNA and DNA) play an increasingly important role due to the growing number of known 3dimensional structures of such molecules. The great complexity of these structures, in particular, those of RNA, demands interactive visualization to get deeper insights into the relationship between the 2D secondary structure motifs and their 3D tertiary structures. Over the last decades, a lot of research in molecular visualization has focused on the visual exploration of protein structures while nucleic acids have only been marginally addressed. In contrast to proteins, which are composed of amino acids, the ingredients of nucleic acids are nucleotides. They form structuring patterns that differ from those of proteins and, hence, also require different visualization and exploration techniques. In order to support interactive exploration of nucleic acids, the computation of secondary structure motifs as well as their visualization in 2D and 3D must be fast. Therefore, in this paper, we focus on the performance of both the computation and visualization of nucleic acid structure. For the first time, we present a ray casting-based visualization of RNA and DNA secondary and tertiary structures, which enables real-time visualization of even large molecular dynamics trajectories. Furthermore, we provide a detailed description of all important aspects to visualize nucleic acid secondary and tertiary structures. With this, we close an important gap in molecular visualization.
69th Annual Meeting of the APS Division of Fluid Dynamics - Gallery of Fluid Motion, 2016
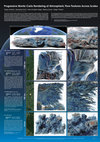
To improve existing weather prediction and reanalysis capabilities, high-resolution and multi-mod... more To improve existing weather prediction and reanalysis capabilities, high-resolution and multi-modal climate data becomes increasingly important. High-resolution numerical simulation of atmospheric phenomena provides new means to understand dynamic processes and to visualize structural flow patterns. In the presented figures, we demonstrate an advanced technique to visualize multiple scales of dense flow fields and Lagrangian patterns therein, simulated by state-of-the-art simulation models for each scale. They provide insight into the structural differences and patterns that occur on each scale and highlight the complexity of flow phenomena in our atmosphere. For visualization, we use an unbiased and consistent Monte-Carlo rendering technique [1]. The 1.000 km Scale (synoptic scale) longitudal range: 1° to 20°, 461 grid cells latitudal range: 44.7° to 56.5°, 421 grid cells height: 0 km to 14 km, 50 grid cells time:
Computer Graphics Forum, 2016
In this report we review and structure the branch of molecular visualization that is concerned wi... more In this report we review and structure the branch of molecular visualization that is concerned with the visual analysis of cavities in macromolecular protein structures. First the necessary background, the domain terminology, and the goals of analytical reasoning are introduced. Based on a comprehensive collection of relevant research works, we present a novel classification for cavity detection approaches and structure them into four distinct classes: grid‐based, Voronoi‐based, surface‐based, and probe‐based methods. The subclasses are then formed by their combinations. We match these approaches with corresponding visualization technologies starting with direct 3D visualization, followed with non‐spatial visualization techniques that for example abstract the interactions between structures into a relational graph, straighten the cavity of interest to see its profile in one view, or aggregate the time sequence into a single contour plot. We also discuss the current state of methods ...

Chemical reactions and molecular vibrations involve simultaneous fluxes of the coupled nuclei (Fn... more Chemical reactions and molecular vibrations involve simultaneous fluxes of the coupled nuclei (Fnuc) and electrons (Fel) in molecules. Here, we use a general quantum method, recently developed in [1], in order to calculate Fnuc and Fel during the degenerate Cope rearrangement of Semibullvalene (SBV) (Fig. 1a). We present high level ab-initio data (CCSD(T)/cc-pVTZ) for the calculation of the potential energy curve and compare to less expensive DFT methods (Fig. 1a). We also present visualizations of the coupled time dependent nuclearand electronic densities during the Cope rearrangement, providing new means for analysis and comprehension of the detailed mechanism underlying the coupled electronicand nuclear fluxes (Fig. 1b, c). Our new approach combines the fields of quantum chemistry for stationary molecular properties and quantum reaction dynamics for electronic and nuclear fluxes, hence allowing us to answer questions like: How many electrons are flowing during the Cope rearrangement of SBV? Are they traveling unidirectionally? On which time scale? Do accurate quantum simulations support traditional rules which are used ubiquitously, e.g. in organic chemistry?

Lecture Notes in Computer Science, 2005
We propose an approach for transforming the sampling of a molecular conformation distribution int... more We propose an approach for transforming the sampling of a molecular conformation distribution into an analytical model based on Hidden Markov Models. The model describes the sampled shape density as a mixture of multivariate unimodal densities. Thus, it delivers an interpretation of the sampled density as a set of typical shapes that appear with different probabilities and are characterized by their geometry, their variability and transition probabilities between the shapes. The gained model is used to identify atom groups of constant shape that are connected by metastable torsion angles. Based on this description an alignment for the original sampling is computed. As it takes into account the different shapes contained in the sampled set, this alignment allows to compute reasonable average shapes and meaningful shape density plots. Furthermore, it enables us to visualize typical conformations.
Mathematics and Visualization, 2014
An intuitive and sparse representation of the void space of porous materials supports the efficie... more An intuitive and sparse representation of the void space of porous materials supports the efficient analysis and visualization of interesting qualitative and quantitative parameters of such materials. We introduce definitions of the elements of this void space, here called pore space, based on its distance function, and present methods to extract these elements using the extremal structures of the distance function. The presented methods are implemented by an image processing pipeline that determines pore centers, pore paths and pore constrictions. These pore space elements build a graph that represents the topology of the pore space in a compact way. The representations we derive from µCT image data of realistic soil specimens enable the computation of many statistical parameters and, thus, provide a basis for further visual analysis and application-specific developments. We introduced parts of our pipeline in previous work. In this chapter, we present additional details and compare our results with the analytic computation of the pore space elements for a sphere packing in order to show the correctness of our graph computation.
In this paper we describe VisiTrace, a novel technique to draw 3D lines in 3D volume rendered ima... more In this paper we describe VisiTrace, a novel technique to draw 3D lines in 3D volume rendered images. It allows to draw strokes in the 2D space of the screen to produce 3D lines that run on top or in the center of structures actually visible in the volume rendering. It can handle structures that only shortly occlude the structure that has been visible at the starting point of the stroke and is able to ignore such structures. For this purpose a shortest path algorithm finding the optimal curve in a specially designed graph data structure is employed. We demonstrate the usefulness of the technique by applying it to MRI data from medicine and engineering, and show how the method can be used to mark or analyze structures in the example data sets, and to automatically obtain good views toward the selected structures.
Fig. 1. From left to right: Deformable tetrahedral model of the pelvic bone enriched with density... more Fig. 1. From left to right: Deformable tetrahedral model of the pelvic bone enriched with density information, virtual X-ray projection of the mean model, two projections of the deformed model showing variation in both shape and density.
3D graphics libraries play an important role in aiding both mathematicians and engineers to visua... more 3D graphics libraries play an important role in aiding both mathematicians and engineers to visualize their data and results. One of the most common graphics libraries is given by the GL (resp. OpenGL) implementation [1] by Silicon Graphics, Inc. However, the results from the GL/OpenGL are not acceptable for high-quality images. The reason for this in inadequacy is due to the missing Phong interpolation of normal vectors [2], the absence of global illumination models and the deficiency of configurable shaders and procedural textures. We present a new 3D graphics library, which combines both the speed of the OpenGL and the rendering quality of professional commercial products. This improvement was achieved by a flexible and extensible concept which integrates the use of different renderer types, user-definable shading procedures and an optimal adaption to many different hardware platforms. Our graphics library allows to preview a complex scene e.g. on a fast SGI machine and produce a high-quality ray traced image from the same source code by changing one line of code when the previewed image is satisfying. Several examples built with our graphics library will be presented along with the introduction of our modelling language. The latter is a comfortable and powerful tool for creating hierarchical scenes which can be imported into our graphics library through the concept of display lists. An outlook to future enhancements of our library will conclude the presentation.





Uploads
Papers by Hans-Christian Hege