Papers by Massimiliano Pasqui
Scopo del presente articolo è illustrare il meccanismo proattivo ed integrato di monitoraggio e p... more Scopo del presente articolo è illustrare il meccanismo proattivo ed integrato di monitoraggio e previsione della siccità che il Consorzio LaMMA e l'Istituto di Biometeorologia (CNR-IBIMET) hanno implementato e stanno validando ed adattando per la regione Toscana, nell'intento di ridurre il gap esistente fra il verificarsi di un evento siccitoso e le risposte degli utenti finali nel gestire le emergenze legate al protrarsi del fenomeno, fornendo informazioni e mappe in tempo quasi reale. Il framework si compone di tre parti: il sistema di monitoraggio, basato su un set di indici di siccità legati a dati a terra di pioggia e a indici derivati da immagini satellitari; il sistema di previsione stagionale dei parametri meteorologici pioggia e temperatura e dell'indice SPI-Standardized Precipitation Index a tre mesi; il sistema di diffusione delle elaborazioni ed analisi basato sull'uso spinto del web. Vengono poi descritte le ulteriori azioni in atto e i possibili sviluppi futuri per integrare e potenziare l'operatività del servizio.

Advances in Science and Research, 2014
055444083), (2) LaMMA Consortium, Sesto Fiorentino, Florence, Italy LaMMA Consortium and IBIMET-C... more 055444083), (2) LaMMA Consortium, Sesto Fiorentino, Florence, Italy LaMMA Consortium and IBIMET-CNR Institute are developing an operational system for drought monitoring and medium-long time forecasts in Tuscany region (Central Italy), in order to deliver periodical, timely, affordable, geo-referenced information about areas affected by an increasing reduction of available water resources. The coupled rainfall based and satellite derived monitoring system, consisting of a set of indices suitable for our region, allows the assessment of vegetation moisture and temperature conditions at different spatio-temporal scales. An analysis of vegetation performances related to temperature and moisture stress is made throughout Normalized Difference Vegetation Index (NDVI) anomalies and Vegetation Health Index (VHI), derived from the Terra-MODIS satellite products. These indices are selected in order to enhance the climate-based Standardized Precipitation Index (SPI) and Effective Drought Index (EDI), which provide multiple time scale drought occurrence and duration. Data of SPI elaborated from daily E-OBS gridded precipitation dataset from the ECA&D (European Climate Assessment & Dataset) project provide the base for seasonal outlooks of drought evolution. Forecasts of the next 1-3 months follow a physically-based statistical approach based on an "adaptive multi-regressive method" that takes into account potential predictors among a list of physical atmospheric indices and Sea Surface Temperature (SST) anomalies. Information about current condition and future evolution of a drought event is periodically delivered on the LaMMA web site and uploaded on an Open Source WebGIS platform. On-line monthly bulletins furnish a detailed description of drought evolution and an analysis of its impacts on forests and main tree crops in the last 30 days and a forecast of the next 3 months. This comprehensive framework can represent a quasi-real time and user-friendly web access multi-purpose operational service for final users, potentially able to give "easy to read" information useful for managing drought-related emergencies as crop yields losses, forest fires and water resources reduction.
Atmospheric Research, 2010
Thermal infrared (IR, 10.5-12.5 μm) images from the Meteosat Visible and InfraRed Imager (MVIRI) ... more Thermal infrared (IR, 10.5-12.5 μm) images from the Meteosat Visible and InfraRed Imager (MVIRI) of cold cloud episodes (cloud top brightness temperature b 241 K) are used as a proxy of precipitating clouds to derive a warm-season (May-August) climatology of their coherency, duration, span, and propagation speed over Europe and the Mediterranean. The analysis focuses over the 30°-54°N, 15°W-40°E domain in May-August 1996-2005. Harmonic analysis using discrete Fourier transforms is applied together with a statistical analysis and an investigation of the diurnal cycle. The objective of the study is to make available a set of results on the propagation dynamics of the cloud systems with the aim of assisting numerical modellers in improving summer convection parameterization. The zonal propagation of cold cloud systems is accompanied by a weak meridional component confined to narrow latitude belts. The persistence of cold clouds over the area evidences the role of orography, the Pyrenees, the Alps, the Balkans and Anatolia. A diurnal oscillation is found with a maximum marking the initiation of convection in the lee of the mountains and shifting from about 1400 UTC at 40°E to 1800 UTC at 0°. A moderate eastward propagation of the frequency maximum from all mountain chains across the domain exists and the diurnal maxima are completely suppressed west of 5°W. The mean power spectrum of the cold cloud frequency distribution evidences a period of one day all over Europe disappearing over the ocean (west of 10°W). Other maxima are found in correspondence of 3 to 7 day synoptic activity. A median zonal phase speed of 16.1 m s − 1 is found for all events ≥ 1000 km and ≥ 20 h and a full set of results divided by year and recurrence categories is also presented. The maxima of the diurnal signal are in phase with the presence of elevated terrain and with land masses.
The key objective of the project "Use of the MSG SEVIRI channels in a combined SSM/I, TRMM and ge... more The key objective of the project "Use of the MSG SEVIRI channels in a combined SSM/I, TRMM and geostationary IR method for rapid updates of rainfall" is the development of algorithms for rapid-update of satellite rainfall estimations at the geostationary (GEO) scale. The new channels available with the Spinning Enhanced Visible and Infrared Imager (SEVIRI) radiometer in the visible (VIS), near infrared (NIR) and infrared (IR) portions of the spectrum provide new insights into the microphysical and dynamic structure of precipitating clouds thus allowing for a more precise identification of precipitation intensities. Passive microwave (PMW) radiometers on board low Earth orbiting (LEO) satellites are used to determine information on the vertical cloud structure. Key features of the new method(s) are:

This research integrates the concept that the subject of natural hazards and the use of existing ... more This research integrates the concept that the subject of natural hazards and the use of existing remote sensing systems in the different phases of a disaster management for a specific hurricane hazard, is based on the applicability of GIS model for increasing preparedness and providing early warning. The modelling of an hurricane event in potentially affected areas by GIS has recently become a major topic of research. In this context the disastrous effects of hurricanes on coastal communities and surroundings areas are well known, but there is a need to better understand the causes and the hazards contributions of the different events related to an hurricane, like storm surge, flooding and high winds. This blend formed the basis of a semi- quantitative and promising approach in order to model the spatial distribution of the final hazard along the affected areas. The applied model determines a sudden onset zoning from a set of available parameters starting from topography based on Shuttle Radar Topography Mission (SRTM) data. From the Digital Elevation Model as a first step the river network is derived and then classified based on the Strahler order account as proportional to flooding area. Then we use a hydrologic model that uses the wetness index (a parameter of specific catchment area defined as upslope area per unit contour length) to better quantify the drainage area that contributes to the flooded events. Complementary data for the final model includes remote sensed density rain dataset for the hurricane events taking into account and existing hurricane tracks inventories together with hurricane structure model (different buffers related to wind speed hurricane parameters in a GIS environment). To assess the overall susceptibility, the hazard results were overlaid with population dataset and landcover. The approach, which made use of a number of available global data sets, was then validated on a regional basis using past experience on hurricane frequency study over an area that covers both developed and developing countries in the Caribbean region. As a final result we can state that remote sensing data analysed together with meteorological and environmental data in an integrated GIS system give a spatially resolved picture of the surface conditions and, in our context, informations on the occurrence, extent and severity of hurricane hazard. The applied GIS model has then given rise to a long-lead system that can be set-up to allow such a early warning to go ahead.
In this paper we report the results of two different investigations recently performed at LaMMA, ... more In this paper we report the results of two different investigations recently performed at LaMMA, with the RAMS model, aimed at improving the predictability of rain storms at the basin scale. They consist in: i) development and preliminary test of a rainfall assimilation procedure, for the ingestion of satellite retrieved rainfall, and ii) analyses of the RAMS response to variation of the resolution of nested gridss. Our rainfall assimilation procedure is based on the inversion of the Kuo convective parameterisation scheme, which is activated in coarse grids, to correct for the errors introduced by the parameterisation of the unresolved convection. Positive effects on finer grids are also expected, due to the communication among grids. Our implementation allows to assimilate rainfall fields during the first simulation hours, and it is designed to be utilised in an operative configuration. The preliminary results show relevant improvement of the quantitative precipitation forecasts, even several hours after the end of the assimilation period. Such work has been developed in the context of the EC project EURAINSAT. The analysis of model performances by varying the nested grids resolution is mainly aimed at defining an optimal configuration, from an operational point of view. The link with rainfall assimilation activity is due to the fact that assimilation works only in coarse grids, so the effects on finer grids, and the overall model performance gain, depend also on the optimisation of the resolution distribution. We report the results obtained in two significant case studies, which allowed us to define a satisfactory grids configuration.
Le foreste rivestono un ruolo fondamentale nell'ambito dei cicli bio-geo-chimici di molti element... more Le foreste rivestono un ruolo fondamentale nell'ambito dei cicli bio-geo-chimici di molti elementi quali, tra gli altri, azoto e carbonio. In particolare possono svolgere l'importante funzione di assorbitori di carbonio, sottraendo CO 2 dall'atmosfera. Per questo, ed in vista dei cambiamenti climatici in atto sul nostro pianeta, un obiettivo importante è quello di quantificare l'effettivo accumulo di carbonio stoccato nelle foreste italiane. A questo ambisce il progetto FIRB C_FORSAT finanziato dal MIUR fino al 2013. Tra le metodologie proposte per raggiungere tale scopo (tecniche di eddy covariance, immagini da satellite e modelli bio-geochimici), quelle basate sull'impiego di modelli di simulazione dell'ecosistema unite all'utilizzo di dati telerilevati risultano le più promettenti. Esse infatti uniscono la possibilità offerta dai modelli di stimare tutti i processi dell'ecosistema (GPP, NPP ed NEE) basandosi sulla conoscenza delle specie analizzate e dell'ambiente in cui si trovano con quella di ottenere informazioni su vasta scala spaziale e con alto grado di ripetizione grazie all'uso di dati tele rilevati. A questo scopo il modello bio-geochimico BIOME-BGC opportunamente calibrato e validato per le principali classi forestali italiane appare particolarmente utile. L'utilizzo del modello in forma spazializzata su base nazionale richiede però la disponibilità di una vasta disponibilità di strati informativi. Tra questi i dati meteorologici giornalieri sono particolarmente critici, in quanto non risultano ancora disponibili sul territorio nazionale. Il contributo richiama brevemente la metodologia utilizzata nel progetto e si sofferma in particolare sull'approccio individuato per la generazione della banca dati meteo spazializzata ed il suo utilizzo per simulare il comportamento della macchia mediterranea.
We propose a new statistical protocol for the estimation of precipitation using lightning data. W... more We propose a new statistical protocol for the estimation of precipitation using lightning data. We first identify rainy events using a scan statistics, then we estimate Rainfall Lighting Ratio (RLR) to convert lightning number into rain volume given the storm intensity. Then we build a hierarchical Bayesian model aiming at the prediction of 15-and 30-minutes cumulated precipitation at unobserved locations and time using information on lightning in the same area. More specifically, we build a Bayesian hierarchical model in which precipitation is modeled as function of lightning count and space time variation is handled using specific structured (random) effects. The mean component of the model relates precipitation and lightning assuming that the number of lightning recorded on a regular grid depends on the number of lightning occurring in neighboring cells. We analyze several model formulations where storms propagation speed, spatial dependence and time variation incorporates different descriptions of the phenomena at hand. The space-time variation is assumed separable. The study area is located in Central Italy, where two storms, that differ for duration and intensity, are presented.
Managing Weather and Climate Risks in Agriculture, 2007
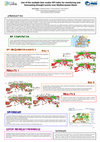
3-6-12 months) are extracted and grouped in its three intensity classes: moderately dry (-1>SP... more 3-6-12 months) are extracted and grouped in its three intensity classes: moderately dry (-1>SPI>-1.5), severely dry (-1.5>SPI>-2), extremely dry (SPI< -2). The number of drought events found in each class represent the frequency of occurrences. As first step, the whole study period is divided in 4 sub-periods of 30 years, with a 10 years moving window method. For each sub-period and intensity class we calculate the number of occurrences. A linear trend analysis is made computing Pearson correlation coefficient, "r". To define the significance of correlation we identify a threshold based on the number of sub-periods. In our case, if |1| > "r" Pearson > |0.8114| the correlation is significative. Hence, the "r" correlation coefficient map is reclassified in three classes, indicating a positive significance (1), a negative significance (-1) or not significance (0). Climatological analysis, monitoring and forecast are three crucial eleme...
In questo capitolo verrà affrontata un’analisi dei dati provenienti dagli studi nazionali ed inte... more In questo capitolo verrà affrontata un’analisi dei dati provenienti dagli studi nazionali ed internazionali relativi alla variabilità climatica. Al fine di rendere la disamina sul clima attuale ed approfondita verranno presentati scenari climatici per il futuro a partire da modelli numerici GCM (General Circulation Model) che saranno poi seguiti da due scenari caratterizzati da due approcci modellisitici strettamente legati allo studio della variabilità climatica: lo statistical downscaling e il dynamical dowscaling.

Climate change scenarios of seasonal minimum, maximum temperature and precipitation over differen... more Climate change scenarios of seasonal minimum, maximum temperature and precipitation over different Italian areas, during the period 2021-2050 against 1961-1990, are assessed. The areas are those selected in the framework of the AGROSCENARI project and are represented by: Padano-Veneta plain, Marche, Beneventano, Destra Sele, Oristano, Puglia and Sicilia, being areas with an important impact for local agricultural practises. A statistical downscaling technique applied to ENSEMBLES global climate simulations (STREAM1), scenario A1B, is used in order to reach this objective. The statistical scheme consists of a multivariate regression based on Canonical Correlation Analysis (CCAReg). The scheme is constructed using large scale fields (predictors) derived from ERA40 ECMWF reanalysis and seasonal mean minimum, maximum temperature and precipitation (predictands) derived from observed daily gridded data (resolution around 35km) belonging to CRA-CMA. The observed period used to set-up the s...


Uploads
Papers by Massimiliano Pasqui