Papers by Simone Fattorini

Journal of Insect Conservation, 2014
ABSTRACT Tenebrionid beetle records from 55 sites in urban Rome (Italy) were used to study the in... more ABSTRACT Tenebrionid beetle records from 55 sites in urban Rome (Italy) were used to study the influence of structural parameters (area, isolation, forest cover, and shape) of green spaces on species richness and extinction trends. In line with biogeographical predictions, species richness correlated positively with area size of green spaces, extinction was enhanced by isolation and hindered by area size, but, in contrast with common findings, forest extent had a negative impact on tenebrionid persistence. This is explained by the fact that most of tenebrionid species from Rome are associated with open habitats typical of the landscape that characterized the study area before modern urbanization. In contrast with results obtained in other studies of urban ecology, distance to city centre (which expresses the urban-rural gradient) was never recovered as an important correlate of tenebrionid richness or extinction, which may be explained by the fact that tenebrionids include both urban avoider and urban adapter species. These results warn against making generalizations on urban diversity patterns and conservation strategies without reference to past land-use and species characteristics.
Biodiversity and Conservation, 2014
ABSTRACT Most studies have attempted to identify the major environmental factors responsible for ... more ABSTRACT Most studies have attempted to identify the major environmental factors responsible for elevational variations in species richness. Such studies have been mainly performed in temperate and tropical areas, whereas the mediterranean biome has been substantially neglected. The aim of this paper was to disentangle the effects of available area, mid-domain constraints, and the environmental tolerance of species, on the altitudinal distribution of tenebrionid beetles in a Mediterranean region. A comprehensive faunistic database was used to assess the elevational distribution of tenebrionids in Latium (Central Italy). Variations in species richness, beta diversity and nestedness were analysed in association with variation in species ranges and midpoints. Variation in species richness was contrasted with patterns expected on the basis of the mid domain effect (MDE) and available surface area. After correcting for differences in area availability due to the conical shape of mountains, an unexpected triphasic pattern emerged: (1) at low altitudes, species richness was higher than expected on the basis of the effect of area and the MDE; (2) at around 800 m elevation, there is an abrupt change in species assemblages, and richness values fit those predicted by the MDE; (3) a new dramatic change occurred at 1,700 m, with tenebrionid assemblages composed of a small number of mainly eurytopic species. The integrated approach used in this study demonstrates that neither MDE nor monotonic patterns fully explain the observed diversity patterns. Variations in species ranges indicate that the elevational gradient filters species according to their ecological tolerance.
Population Ecology, 2013
Searching for nestedness has become a popular exercise in community ecology. Significance of a ne... more Searching for nestedness has become a popular exercise in community ecology. Significance of a nestedness index is usually evaluated using z values, and finding that a matrix is nested is typically a common result. However, nestedness is not likely to be spread uniformly within a matrix of species presence/absence per site. Selected parts of the matrix may show a degree of nestedness significantly higher (or lower) than expected from the overall pattern. Here we describe a procedure to assess if a particular submatrix (i.e., a peculiar combination of rows and columns extracted from the complete matrix) is more or less nested than expected for an assortment of sites and species taken at random from the same overall matrix. The idea is to obtain several submatrices of different sizes from the same overall matrix and to calculate their z values. A regression is then performed between z values of submatrices and their sizes. A nestedness index independent of matrix size is suggested as the deviation of the z value of a particular submatrix from that expected according to the regression line. We applied our protocol to 55 matrices with different nestedness indices under various null-models and, for purpose of demonstration, we discussed in detail a single case study regarding various animal groups of the Aegean Islands (Greece). The obtained results strongly encourage further research to focus not only on the question whether a matrix is nested or not, but also on where and why nestedness is confined.
Biological Conservation, 2014
Ital J Zoology, 2007
The species–area relationship (SAR) is one of the best documented patterns in macroecology and ha... more The species–area relationship (SAR) is one of the best documented patterns in macroecology and has wider applications. Measures of areas used in SARs are planar surfaces, not true surface sizes. To explain this difference I assimilated islands to cones, where the cone base is the planar area, and the cone lateral surface is the actual island area. Then, I applied the power function to 20 real‐world archipelagos using both the island planar area and the lateral surface area of a cone calculated using island elevations. ...
Bollettino Della Societa Entomologica Italiana, Dec 15, 2014
Ital J Zoology, 2011
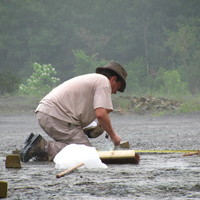
Abstract We investigated riparian ground beetle communities to:(1) identify the main environmenta... more Abstract We investigated riparian ground beetle communities to:(1) identify the main environmental factors determining species composition;(2) determine whether sites with similar ecological characteristics have similar species composition as a result of local selection; and (3) provide some indications for conservation of these insects. For 45 sampling sites in the River Aniene we measured: elevation, river bank morphology, percentage of shaded area, habitat heterogeneity, sediment depth, sediment ...
Entomologia, Oct 14, 2013
Int ern atio nal Jou rna l of En tom olo gy E n t o m o l o g i a en to m ol og ia jo ur na l.o r... more Int ern atio nal Jou rna l of En tom olo gy E n t o m o l o g i a en to m ol og ia jo ur na l.o rg Iss ue 1 Entomologia

Recent theoretical advances in nestedness analysis have led to the introduction of several altern... more Recent theoretical advances in nestedness analysis have led to the introduction of several alternative metrics to overcome most of the problems biasing the use of matrix 'temperature' calculated by Atmar's Nestedness Temperature Calculator. However, all of the currently available programs for nestedness analysis lack the user friendly appeal that has made the Nestedness Temperature Calculator one of the most popular community ecology programs. The software package NeD is an intuitive open source application for nestedness analysis that can be used online or locally under different operating systems. NeD is able to automatically handle different matrix formats, has batch functionalities and produces an output that can be easily copied and pasted to a spreadsheet. In addition to numerical results, NeD provides a graphic representation of the matrix under examination and of the corresponding maximally packed matrix. NeD allows users to select among the most used nestedness metrics, and to combine them with different null models. Integrating easiness of use with the recent theoretical advances in the field, NeD provides researchers not directly involved in theoretical debates with a simple yet robust statistical tool for a more conscious performance of nestedness analysis. NeD can be accessed at http: //purl.oclc.org/ned.
International Journal for Parasitology
Accumulation curves are useful tools to estimate species diversity. Here we argue that they can a... more Accumulation curves are useful tools to estimate species diversity. Here we argue that they can also be used in the study of global parasite species richness. Although this basic idea is not completely new, our approach differs from the previous ones as it treats each host species as an independent sample. We show that randomly resampling host–parasite records from the existing databases makes it possible to empirically model the relationship between the number of investigated host species, and the corresponding number of parasite species retrieved from those hosts. This method was tested on 21 inclusive lists of parasitic worms occurring on vertebrate hosts. All of the obtained models conform well to a power law curve. These curves were then used to estimate global parasite species richness. Results obtained with the new method suggest that current predictions are likely to severely overestimate parasite diversity.

Biodiversity and Conservation, 2015
Patterns in phylogenetic diversity are poorly known for many taxonomic groups, including hyperdiv... more Patterns in phylogenetic diversity are poorly known for many taxonomic groups, including hyperdiverse insect taxa. We contrasted patterns in the species richness and phylogenetic diversity of provincial beetle faunas in northern Europe (54°N to 71°N). We found that species richness and phylogenetic diversity varied rather predictably along ecogeographical gradients, with species richness and a proxy measure of phylogenetic diversity, average taxonomic distinctness (AvTD), decreasing from south to north and being strongly positively related to maximum temperature. A proxy measure of variation in phylogenetic diversity, variation in taxonomic distinctness (VarTD), was also strongly related to maximum temperature, but the relationship was negative. This was a novel finding, showing a reversed latitudinal gradient in biodiversity. In more than half of the provinces, AvTD value was significantly less than expected by chance. Also, more than half of the provinces showed significantly higher VarTD values than expected based on random draws of species. Our results showed that the phylogenetic diversity of beetle faunas is rather strongly associated with climatic gradients at high latitudes. Given that climatic variability and temperature extremes are correlated with phylogenetic diversity, climate change is likely to modify strongly this facet of diversity. Average phylogenetic Communicated by Dirk Sven Schmeller.
PLOS ONE, 2015
Ants use various communication channels to regulate their social organisation. The main channel t... more Ants use various communication channels to regulate their social organisation. The main channel that drives almost all the ants' activities and behaviours is the chemical one, but it is long acknowledged that the acoustic channel also plays an important role. However, very little is known regarding exploitation of the acoustical channel by myrmecophile parasites to infiltrate the ant society. Among social parasites, the ant nest beetles (Paussus) are obligate myrmecophiles able to move throughout the colony at will and prey on the ants, surprisingly never eliciting aggression from the colonies. It has been recently postulated that stridulatory organs in Paussus might be evolved as an acoustic mechanism to interact with ants. Here, we survey the role of acoustic signals employed in the Paussus beetle-Pheidole ant system. Ants parasitised by Paussus beetles produce caste-specific stridulations. We found that Paussus can "speak" three different "languages", each similar to sounds produced by different ant castes (workers, soldiers, queen). Playback experiments were used to test how host ants respond to the sounds emitted by Paussus. Our data suggest that, by mimicking the stridulations of the queen, Paussus is able to dupe the workers of its host and to be treated as royalty. This is the first report of acoustic mimicry in a beetle parasite of ants.
Fragmenta Entomologica, 2015
Many recent researches in island biogeography attempted to disentangle the effects of area per se... more Many recent researches in island biogeography attempted to disentangle the effects of area per se and "habitat diversity" on species richness. However, the expression "habitat diversity" in this context should be avoided, because habitats can be only recognized by referring to the resources needed by a particular species. What is really measured in such researches is some form of "environmental heterogeneity". Although habitat heterogeneity can be measured in various ways, most researches in island biogeography simply used the number of biotopes (typically classified as land cover categories). However, not all biotopes have the same surface.On the basis of the area occupied by each land cover category, it is possible to calculate indices of environmental diversity, evenness and dominance, as commonly done in community ecology research. These indices can be used to investigate the role of environmental diversity in determining species richness. We used the tenebrionid beetles inhabiting twenty-five small islands around Sicily (Central Mediterranean) to illustrate these concepts. We found that both area per se and environmental heterogeneity contributed to determine species richness. Moreover, we found that the relationship between species richness and environmental homogeneity followed a power function model. This indicates that environmental homogenization may determine a rapid, non linear decline in species richness.

Journal of Insect Biodiversity
Rarity is often considered an indication of species extinction risk, and rarity measures are used... more Rarity is often considered an indication of species extinction risk, and rarity measures are used as important tools to predict species vulnerability and hence to establish conservation priorities. For these reasons, rarity is among the most important issues involved in conservation programs. A number of studies have attempted to investigate relationships between rarity and extinction risk in plants and vertebrates, whereas only few papers have investigated similar issues in invertebrate taxa. This has limited the use of standardized rarity measures in invertebrate conservation studies. Assessing rarity is especially important when other pieces of information are difficult, or even definitively impossible, to obtain, as commonly found for most insects. Four broad categories of rarity are commonly recognized: geographical, ecological, population and phylogenetic rarity. On the basis of this framework, we present here a short review of the rarity forms most frequently investigated in insect studies, and their relationships with the main species traits related to extinction risk (such as body size, mobility, trophic level, host specificity, larval and adult behaviours, etc.). We discuss what they mean, how they can be measured, which type of data (field collections, museum data, literature information) are needed and how to avoid the most common pitfalls associated with rarity studies, with indications for pragmatic approaches in data analysis.
Rendiconti Lincei, 2015
ABSTRACT We used the carabid beetles inhabiting the Castelporziano Presidential Estate reserve (a... more ABSTRACT We used the carabid beetles inhabiting the Castelporziano Presidential Estate reserve (a natural reserve of some 60 ha facing the Tyrrhenian sea) to show how chorotypes (i.e. species distribution types) can be used to characterise insect communities. We compared three forms of diversity: species richness, Clarke and Warwick taxonomic diversity and chorological composition. Chorological composition was modelled using Menhinick, Margalef, Shannon, and Brillouin diversity, Simpson dominance, Pielou evenness and Buzas and Gibson evenness. Variations in carabid species richness, chorological composition (richness, diversity, dominance and evenness) and taxonomic diversity among biotopes followed different patterns thus providing complementary not redundant information. Beach, dunes, high maquis and oak forest were biotopes with low species richness, whereas wet woodlands, mixed forest, wet zones and open areas have high species richness. Low maquis had an intermediate position. This subdivision is substantially confirmed by indices of chorological composition. However, in contrast with large variations in diversity indices, evenness was substantially similar, and relatively high in all biotopes, even those with very small numbers of species. Taxonomic diversity was also similar among biotopes, being however small in oak forests and open areas. When species richness, chorological diversity and taxonomic diversity were used to calculate an index of overall conservation interest, the most important biotopes resulted to be wet zones, wet woodlands, open areas and mixed forest. These results clearly indicate that the carabid communities with high conservation values are those associated with humid environments. This is consistent with the hypothesis that most of the carabids species occurring in the study area are hygrophilous elements, associated with wetlands, which shifted their range southwards during the glacials, and which form a relict component of the carabid fauna of coastal areas.
Rendiconti Lincei, 2015
ABSTRACT We investigated the conservation concern of landscape-soil units within Castelporziano l... more ABSTRACT We investigated the conservation concern of landscape-soil units within Castelporziano lowland forest (a natural reserve of 6,000 hectares facing the Tyrrhenian Sea) using tenebrionid species vulnerability as defined by the Kattan index, which is based on species rarity, and IUCN categories. Species rarity was evaluated according to various measures of geographical distribution, habitat specialization and population size on a regional level. Measures of species vulnerability were combined into two indexes of conservation concern for each landscape-soil unit: (1) the Biodiversity Conservation Concern index, BCC, which reflects the average rarity score of the species present in a site, and (2) the Biodiversity Conservation Weight, BCW, which reflects the sum of rarity scores of the same species assemblage. Because the same species was subject to multiple evaluations under different criteria, we obtained various series of BCC and BCW values. BCC and BCW provided complementary information and the use of different scoring schemes of species vulnerability produced correlated, but not identical conservation ranking in landscape-soil unit prioritization. Forests, wetlands and beach-dunes were identified as high priority units, whereas dry pastures, traditional crop mosaics, pinewoods and maquis/garrigue shrublands, were identified as medium-low priority units. Tenebrionids were proved to be particularly useful as a bio-indicator group in coastal areas because they include both sand-dwelling and saproxylic species, being distributed, with distinct communities, in all coastal biotopes.
Biodiversity Data Journal, 2015


Uploads
Papers by Simone Fattorini