The Long Beach/Fort Lauderdale relative risk study
 Raymond Peck
2009, Journal of Safety Research
visibility
…
description
8 pages
link
1 file
AI-generated Abstract
This study updates the relative risk associated with alcohol consumption and driving, using data collected from a case-control study in Long Beach, California and Fort Lauderdale, Florida. A total of at least 1,300 crash samples were analyzed, showing a dose-response relationship between Blood Alcohol Concentration (BAC) levels and crash risk, particularly increasing significantly at BACs above 0.04%. Statistical analyses included logistic regression to derive relative risk curves, providing insights into the dangers of driving under the influence of alcohol.
Sign up for access to the world's latest research
checkGet notified about relevant papers
checkSave papers to use in your research
checkJoin the discussion with peers
checkTrack your impact
Figures (2)

Related papers
A method for estimating crash risk associated with driver BAC
Transportation Research Part E: Logistics and Transportation Review, 2005
A method is presented for estimating the risk of driver involvement in injury crashes for case-control data where control drivers have reliable measures of BAC (blood alcohol concentration) and other driver characteristics, but crash-involved drivers do not have BAC measures. The usual estimates of risk associated with BAC derived from case-control studies depend on the provision of driver BAC for virtually all case (crash-involved drivers) and control (drivers on the road) samples. The method described here makes use of the case-control study design but requires only the total numbers of case drivers within groups of drivers defined by variables common to both samples. The risk associated with BAC of New Zealand driver night-time involvement in injury crashes is estimated to illustrate the application of this method.
Crash Risk of Alcohol Impaired Driving
In order to determine the relative crash risk of drivers at various blood alcohol concentration (BAC) levels a case-control study was conducted in Long Beach, CA and Fort Lauderdale, FL. Data was collected on 4,919 drivers involved in 2,871 crashes of all severities. In addition, two drivers at the same location, day of week and time of day were sampled a week after a crash, which produced 10,066 control drivers. Thus, a total of 14,985 drivers were included in the study. Relative risk models were generated using logistic regression techniques with and without covariates such as driver age, gender, marital status, drinking frequency and ethnicity. The overall result was in agreement with previous studies in showing increasing relative risk as BAC increases, with an accelerated rise at BACs in excess of .10 BAC. After adjustments for missing data (hit-and-run drivers, refusals, etc.) the result was an even more dramatic rise in risk, with increasing BAC that began at lower BACs (abov...
Estimating the Effect of Alcohol on Driver Risk Using Only Fatal Accident Statistics
1999
Because many fatal crashes involve more than one vehicle, the actual fraction of drinking drivers involved in these crashes is lower than the values cited above. Overall, roughly 30 percent of drivers in fatal crashes have been drinking, with that percentage rising to 50 percent during peak alcohol usage times. 2 There is also survey data asking drivers whether they have driven when they have "had too much to drink" (Liu et al 1997). In addition to any question about the accuracy of the responses given, these surveys have not attempted to ask drivers to report the percentage of miles driven with and without the influence of alcohol. Without that number, accurate estimates of the elevated risk of drinking drivers cannot be computed.
Fatal traffic crashes involving drinking drivers: what have we learned?
Annals of advances in automotive medicine / Annual Scientific Conference ... Association for the Advancement of Automotive Medicine. Association for the Advancement of Automotive Medicine. Scientific Conference, 2009
Alcohol involvement in fatal crashes (any driver with a blood alcohol concentration [BAC] = .01g/dL or greater) in 2007 was more than three times higher at night (6 p.m.-6 a.m.) than during the day (6 a.m.-6 p.m.) (62% versus 19%). Alcohol involvement was 35% during weekdays compared to 54% on weekends. Nearly one in four drivers (23%) of personal vehicles (e.g., passenger cars or light trucks) and more than one in four motorcyclists (27%) in fatal crashes were intoxicated (i.e., had a BAC equal to or greater than the .08 g/dL illegal limit in the United States). In contrast, only 1% of the commercial drivers of heavy trucks had BACs equal to .08 g/dL or higher. More than a quarter (26%) of the drivers with high BACs (>or=.15 g/dL) did not have valid licenses. The 21- to 24-age group had the highest proportion (35%) of drivers with BACs>or=.08 g/dL, followed by the 25- to 34-age group (29%). The oldest and the youngest drivers had the lowest percentages of BACs>or= .08 g/dL...
Alcohol intoxication in drivers in road traffic accidents and violations
Alcoholism and psychiatry research, 2013
INTRODUCTIONRoad traffic injuries have become a global developmental and health issue. The likelihood of accidents in general and accidents with fatal outcomes may depend on a large number of factors. Some among these are the condition of roads, the number of vehicles on the roads, population size, population density, economic situation,1"2 the percentage of young drivers3 in traffic, while some relate to the characteristics of the drivers and the manner of driving. Thus, the researchers found out that the economic growth results in the increase of the number of registered vehicles,1"2 i e. vehicles that are in use and consequently in a larger number of road accidents. With regard to road accidents with fatal outcome, some authors observed their decrease and others increase2 linked to the economic growth. Bener and Crundall4 conclude that the number of accidents with fatal outcome decreases with the growth of the number of vehicle owners. They associate it with the lower n...
Alcohol-related risk of driver fatalities: an update using 2007 data
Journal of studies on alcohol and drugs, 2012
The purpose of this study was to determine whether the relative risk of being involved in an alcohol-related crash has changed over the decade from 1996 to 2007, a period during which there has been little evidence of a reduction in the percentage of all fatal crashes involving alcohol. We compared blood-alcohol information for the 2006 and 2007 crash cases (N = 6,863, 22.8% of them women) drawn from the U.S. Fatality Analysis Reporting System (FARS) with control blood-alcohol data from participants in the 2007 U.S. National Roadside Survey (N = 6,823). Risk estimates were computed and compared with those previously obtained from the 1996 FARS and roadside survey data. Although the adult relative risk of being involved in a fatal alcohol-related crash apparently did not change from 1996 to 2007, the risk for involvement in an alcohol-related crash for underage women has increased to the point where it has become the same as that for underage men. Further, the risk that sober underag...
Effects of alcohol on automated and controlled driving performances
Psychopharmacology, 2013
Rationale: Alcohol is the most frequently detected substance in fatal automobile crashes, but its precise mode of action is not always clear. Objective: The present study was designed to establish the influence of blood alcohol concentration as a function of the complexity of the scenarios. Road scenarios implying automatic or controlled driving performances were manipulated in order to identify which behavioral parameters were deteriorated. Method: A single blind counterbalanced experiment was conducted on a driving simulator. Sixteen experienced drivers (25.3 ± 2.9 years old, 8 men and 8 women) were tested with 0, 0.3 g/l, 0.5 g/l and 0.8 g/l of alcohol. Driving scenarios varied: road tracking, car following and an urban scenario including events inspired by real accidents. Statistical analyses were performed on driving parameters as a function of alcohol level. Results: Automated driving parameters such as standard deviation of lateral position (SDLP) measured with the road tracking and car following scenarios were impaired by alcohol, notably with the highest dose. More controlled parameters such as response time to braking and number of crashes when confronted with specific events (urban scenario) were less affected by the alcohol level. Conclusion: Performance decrement was greater with driving scenarios involving automated processes than with scenarios involving controlled processes.
Occurrence of critical driver's behavior as a result of alcohol intoxication
Neuro endocrinology letters, 2011
Operator's movements are one of the areas where variability is undesirable. Vehicle driving is probably the most frequent operator movement in society where errors can result in serious social, medical and economic consequences. In this article we focused on the influence of moderate alcohol intoxication (less then 1.0 g/kg) on right hand movement variability during manual gear selection and on driving ability. The test took place in a laboratory setup in a passenger vehicle simulator. Simulated traffic lights were used to stop the car and hand movement was measured by kinematical analysis with the use of a motion capture system. Large variability in blood alcohol concentrations were observed as well as large intra-individual hand movement variability and reaction time to visual stimulus. The findings are somewhat ambiguous. Research outcomes did not confirm the hypothesis about the impact of moderate alcohol intoxication on movement variability. On the other hand, in some cases...
Crash culpability and the role of driver blood alcohol levels
Annual proceedings / Association for the Advancement of Automotive Medicine. Association for the Advancement of Automotive Medicine, 2006
Twenty years ago the American Medical Association reported the relationship between blood alcohol concentration (BAC) and crash causation. This study addresses culpability, age, gender and BAC in a population of drivers injured in motor vehicle crashes. Five years of hospital and crash data were linked, using probabilistic techniques. Trends in culpability were analyzed by BAC category. Given BAC level, the youngest and oldest drivers were more likely to have caused their crash. Women drivers had significantly higher odds of culpability at the highest BAC levels. Seatbelt use was also associated with culpability, perhaps as a marker for risk-taking among drinkers.
Commentary: Alcohol and Motor Vehicle–Related Crashes—Driver Attitudes Need Further Intervention
Annals of Emergency Medicine, 2011
T2007 – Seat t le, Washingt on
The Long Beach/Fort Lauderdale Relative Risk Study 1
R.D. Blomberg 2 , R.C. Peck 3 , H. Moskowitz 4 , M. Burns4, D. Fiorentino4
A case-control study funded by the National Highway Traffic Safety Administration
(NHTSA) and the National Institute on Alcohol Abuse and Alcoholism (NIAAA) examined the
relative crash risks associated with drivers’ blood alcohol concentrations (BACs). The measure,
relative crash risk, is defined as the ratio of the proportion of crash drivers to the proportion of
control drivers in a BAC classification, compared to a similarly formed ratio of drivers with
0.00% BACs. The resulting detailed final report by Blomberg, Peck, Moskowitz, Burns and
Fiorentino (2005) details both the extensive methodological development of the study and a first
set of analyses of its data. This paper summarizes the study’s approach and results.
The specific objectives of the study were to:
•
•
Determine the relative crash risk of drivers at various BACs compared to drivers with
zero BACs while controlling for other factors (e.g., age, gender, drinking patterns)
Determine the relative crash risk of groups of drivers (e.g., youth, males, heavy drinkers)
at various BACs compared to similar groups with zero BACs.
Background
A relative risk function derived from epidemiological data collected in Grand Rapids,
Michigan during the 1960s is the primary basis for the current legal limits for driving after
drinking (Borkenstein et al., 1964). It is possible, however, that changes in driving, alcohol
consumption, or drinking-driving practices have occurred during the decades since that study
was conducted, and that the changes altered the relative risks associated with the combination of
alcohol and driving. There have also been significant advances in the measurement of BAC and
in statistical techniques for analyzing case-control data that could enhance the type of
information to be obtained from a case-control study. Since regulatory agencies and legislators
need current information about the crash risks associated with driving at BACs above zero, a
new study to update the epidemiological evidence was conducted.
1
Prepared for presentation at T2007 – the combined annual meetings of the International Council on Alcohol, Drugs, and Traffic
Safety (ICADTS) and The International Association of Forensic Toxicologists (TIAFT) together with the 8th Ignition Interlock
Symposium (IIS), Seattle, WA, U.S.A., August 26-30, 2007.
2
Dunlap and Associates, Inc., Stamford, CT, U.S.A.
3
R.C. Peck and Associates, Folsom, CA, U.S.A.
4
Southern California Research Institute, Los Angeles, CA, U.S.A.
Research Approach
A case-control approach was adopted for the study that involved the following
particulars:
•
•
•
•
•
•
•
During 12-month periods, data were collected in two locations to acquire samples of at
least 1,300 crashes at each site.
Data were obtained from crash-involved (case) and non-crash-involved (control) drivers
during the hours 1600 - 0200 in Long Beach, California and 1700 - 0300 in Fort
Lauderdale, Florida. The evening and nighttime hours were selected for sampling
because drivers who have been drinking are most likely to be on the roadways at those
times.
A two-person research team consisting of a police officer and an interviewer collected the
data from crash and control drivers.
Drivers involved in crashes and non-crash involved control drivers were matched for
crash location, day, time, and travel direction. Control drivers were obtained one week
after a crash at the same site, traveling in the same direction, on the same day of the week
and at the same time of day. Using random selection procedures, drivers in the flow of
traffic were stopped and asked to participate in the study. Two control drivers were
sampled for each crash-involved driver.
Interviews with crash and control drivers were conducted using an identical questionnaire
to obtain data about the covariates of drinking and driving such as drinking history, sleep
patterns and demographic data.
Drivers’ BACs were measured at roadside by obtaining breath specimens with evidential
quality portable/preliminary breath testers (PBTs). Hospitalized and fatally-injured
drivers’ BACs were obtained from the analyses of blood specimens by police, hospitals,
and coroners.
Systematic observations by the research teams, together with BAC estimates obtained
using passive alcohol sensors (PAS), provided additional information about drivers’ use
of alcohol. These data served as the basis for estimates of the bias resulting from the
refusal of some drivers to provide the evidential quality breath specimens.
A complete, single case for the statistical analysis of BAC and crash risk therefore included
questionnaire information, police crash report data and field team observations on a crash driver,
two control drivers and the location of the crash.
Statistical Analysis
Relative risk curves describing the relationship between BAC and crash risk were derived
from a sequence of univariate and multivariate logistic regression analyses. After establishing
simple univariate models, more complex models were derived in which the relative risk
estimates were adjusted for potentially confounding covariates (e.g., age, education) and other
sources of bias, such as refusal to provide a BAC specimen and non-recovered hit and run cases.
Most of the models were based on the total sample and all crashes, but separate analyses were
also done for the two sites (Long Beach and Fort Lauderdale), type of crash, and other subgroups
of interest (e.g., age and alcohol consumption patterns). The statistical analyses produced
answers to the following questions:
•
•
•
•
•
•
How does crash risk increase as a function of a driver’s BAC?
Is the relationship between BAC and crash risk materially altered by controlling potential
sources of bias and confounding covariates?
Is the BAC-crash relative risk curve similar for different crash types?
Is the BAC-crash relative risk curve similar for the two study sites (Long Beach and Fort
Lauderdale)?
Does the BAC-crash relative risk curve vary by driver characteristics, such as age, gender
and alcohol consumption patterns?
How accurately can individual crash involvement be predicted from knowledge of a
driver’s BAC and other characteristics?
Results
A total of 2,871 crashes (Long Beach 1,419; Fort Lauderdale 1,452) yielded 4,919 crash
and 10,066 control drivers (14,985 total). In total, 93.5% of the drivers who were contacted at
crash scenes agreed to participate. An additional 603 fled the scene of their crash. One hundred
four (17.2%) of those hit-and-run drivers were located within two hours of the crash, and 94
(90.4%) provided breath specimens. Those who were not located or refused to participate
reduced the participation rate of crash-involved drivers to 83.1% and the percentage who
provided usable breath specimens to 81.3%. Non-crash drivers participated as controls at a
higher rate of 97.9%.
Since the data obtained in California and Florida proved to be similar, most of the
logistic regression analyses were performed on the total data set. The analyses showed elevated
relative risk with increasing BAC and a strongly accelerated risk at BACs greater than 0.10%.
The influence of covariates on the magnitude and shape of the curve based on these initial
analyses was relatively modest. It is important to note, however, that the scope of the initial
study funded by NHTSA and NIAAA did not include all of the analyses of potential interest
from the collected data. For this reason, the data and associated codebooks were delivered to
NHTSA and made available to the research community for further detailed analyses (c.f., Peck,
Gebers, Voas and Romano, 2007; Romano, Peck and Voas, 2007; Voas, Peck, Romano and
Gebers, 2007).
As part of the analysis of the data, it was assumed that crash risk was underestimated in
analyses of the “raw” or uncorrected case and control data because of three sources of bias:
•
•
•
Differences in non-participation rates between the crash and control groups—Alcohol
positive crash drivers refused to participate and failed to complete the interview more
often than did other classes of drivers sampled.
Non-apprehended hit-and-run drivers—The BACs of hit-and-run drivers who were
apprehended were much higher than BACs of drivers who did not flee their crash scene.
Missing covariate data due to non-participation or incomplete interviews.
Re-weighting adjustments based on observational data and PAS estimates of BACs were used to
correct for these biases. The resulting adjusted model of relative risk showed greater risks at all
BACs with large increases at high BACs. This confirmed the assumption that the biasing sources
were suppressing the relative risk estimates.
Table 1 displays calculated relative risks from: a model with no covariates (column 2); a
model with demographic covariates (column 3); and a model adjusted for all three major biases
discussed above (column 4). Column 5 is from a model developed by Allsop (1966) based on
the Grand Rapids Study data (Borkenstein et al., 1964) and is comparable to the no-covariate
model for this study.
Table 1. Relative Risk Models
Relative Risk
No
Covariates
0.00
1.00
Non-reactive
Demographic
Covariates
1.00
.01
.91
.94
1.03
.92
.02
.87
.92
1.03
.96
.03
.87
.94
1.06
.80
.04
.92
1.00
1.18
1.08
.05
1.00
1.10
1.38
1.21
.06
1.13
1.25
1.63
1.41
.07
1.32
1.46
2.09
1.52
.08
1.57
1.74
2.69
1.88
.09
1.92
2.12
3.54
1.95
.10
2.37
2.62
4.79
.11
2.98
3.28
6.41
.12
3.77
4.14
8.90
.13
4.78
5.23
12.06
.14
6.05
6.60
16.36
.15
7.61
8.31
22.10
.16
9.48
10.35
29.48
.17
11.64
12.74
39.05
.18
14.00
15.43
50.99
.19
16.45
18.31
65.32
.20
18.78
21.20
81.79
.21
20.74
23.85
99.78
.22
22.07
25.99
117.72
.23
22.51
27.30
134.26
.24
21.92
27.55
146.90
BAC
Final Adjusted
Estimate
Grand Rapids*
1.00
1.00
5.93
4.94
10.44
21.38
153.68
20.29
26.60
.25+
*From reporting of Grand Rapids Study data in Table 25 (a) of Allsop (1966).
Logistic regression analyses were performed for subgroups of the driving population
(e.g., youth, heavy drinkers), but each subgroup was small. It is unclear from these analyses
whether the small samples account for unexpected findings such as the absence of increased risk
for young drivers at low BACs. This issue cannot be resolved without larger numbers in the
subgroups or more sensitive analyses such as those performed by Peck et al. (2007) and Voas et
al. (2007).
The study data clearly demonstrate that case-control studies need to control or adjust for
differential non-participation and non-random missing data, particularly for the loss of data from
hit-and-run drivers. The effect of these sources is evident in a comparison of the third and fourth
columns of Table 1. Note the magnitude of the underestimation of relative risk at very high
BACs evident in the risks adjusted only for non-reactive covariates (column 2). For example, the
relative risk of 26.60 at BACs > 0.25% in column 3 becomes 153.68 when it is adjusted for the
hit and run and refusal biases (column 4).
When adjusted for non-participation and missing data bias, the results suggest that the
small dip observed at 0.01– 0.03% BAC in the unadjusted risk calculations (columns 2 or 3 in
Table 1) may be an artifact of sampling errors and small sample biases. The magnitude of the
adjusted risk elevations are too small in relation to the standard errors of the model, however, to
reject either the hypothesis of no increase or even an hypothesis of slight decreases in risk at 0.01
– 0.03% BAC. Regardless of the direction of the risk change, if any, at these low BACs,
however, the size of the relative risk deviation from unity is sufficiently small to be of absolutely
no practical consequence.
In a re-analysis of the Grand Rapids data, Hurst, Harte and Frith (1994) also showed that
the relative risk curve changed substantially and an observed decrease or dip in risk at low BACs
disappeared with an adjustment for drivers’ drinking frequency. Although the final adjusted risk
curve (column 4 in Table 1) from the present study failed to replicate the phenomenon and
artifact noted by Hurst, Harte and Frith (1994) , the present analysis, as discussed above, did
show the existence of a similar dip in the model with no covariates. This dip disappeared when
adjusted for the sources of bias discussed above. As mentioned, however, the dip, even if real, is
of such small magnitude that it is of academic interest only and does not represent anything that
needs to be considered in policy making.
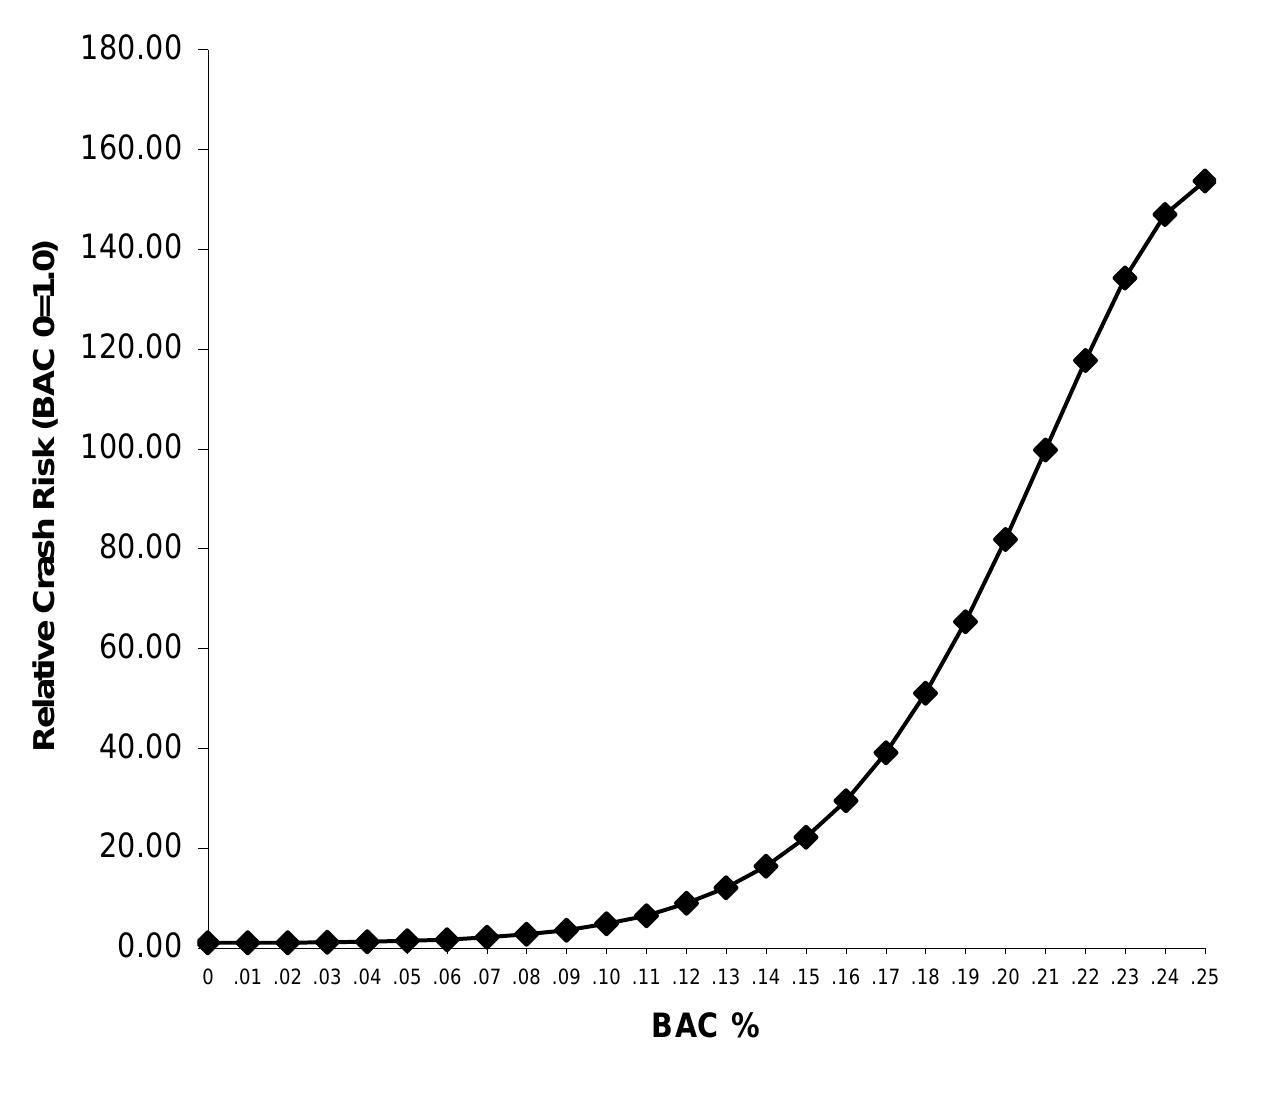
The study results with respect to general relative risk due to alcohol confirm a notable
dose-response relationship beginning at 0.04% BAC and increasing exponentially at > 0.10%
BAC. The adjusted relative risk function (column 4 in Table 1) is graphed in Figure 1 and
illustrates the extraordinary magnitude of the crash risk at high BACs.
It must be noted that the analyses performed on the data as part of the data collection
study represent only a small portion of the potential inherent in the collected information. It is
fully anticipated that further analyses such as those by Peck et al., (2007), Romano, Peck and
Voas (2007) and Voas et al. (2007) will provide additional insights into the basic alcohol and
crash risk relationship and various additional nuances based on more detailed examinations of
the abundance of covariate information collected.
180.00
Relative Crash Risk (BAC 0=1.0)
160.00
140.00
120.00
100.00
80.00
60.00
40.00
20.00
0.00
0 .01 .02 .03 .04 .05 .06 .07 .08 .09 .10 .11 .12 .13 .14 .15 .16 .17 .18 .19 .20 .21 .22 .23 .24 .25
BAC %
Figure 1. Final Adjusted Relative Risk Estimate
Acknowledgements
Funded by the National Highway Traffic Safety Administration and the National Institute
on Alcohol Abuse and Alcoholism under Contract No. DTNH22-94-C-05001.
References
Allsop, R. E. (1966). Alcohol and Road Accidents. (Road Research Laboratory Report
No. 6). Harmondsworth, England: Road Research Laboratory, Ministry of Transport.
Blomberg, R., Peck, R.C.. Moskowitz. H. Burns, M. and Fiorentino, D. (2005). Crash
Risk of Alcohol Driving: A Case-Control Study. Stamford, CT: Dunlap & Associates (available
at http://www.dunlapandassociatesinc.com/Publications.html).
Borkenstein, R. F., Crowther, R. F., Shumate, R. P., Zeil, W. W., and Zylman, R. (1964).
The role of the drinking driver in traffic accidents. Bloomington, IN: Department of Police
Administration, Indiana University.
Hurst, P.M., Harte, D. and Frith, W.J. (1994). The Grand Rapids dip revisited. Accident
Analysis and Prevention, 26(5), 647-654.
Peck, R.C., Geebers, M.A., Voas, R.B. and Romano, E. (2007). Improved methods for
estimating relative crash risk in a case-control study of blood alcohol levels. Presentation at
T2007, Seattle, WA, August 26-30,2007.
Romano, E., Peck, R.C. and Voas, R.B. (2007). A comparison study of factors affecting
driving and crashes (alcohol-related or not). Presentation at T2007, Seattle, WA, August 2630,2007.
Voas, R.B., Peck, R.C., Romano, E. and Geebers, M.A. (2007). Alcohol-related crashes:
relative risk by demographic groups. Presentation at T2007, Seattle, WA, August 26-30,2007.
Related papers
Hexahistidine-tag-specific optical probes for analyses of proteins and their interactions
Analytical Biochemistry, 2010
Cognitive mediators and sex-related differences in mathematics
Intelligence, 2004
Hatchery selection may depress the number of motile sperm but intensify selection for their swimming velocity in the Arctic charr
Aquaculture International, 2013
Evidence for ongoing brain injury in human immunodeficiency virus-positive patients treated with antiretroviral therapy
Journal of neurovirology, 2009
EFFECT OF MID DAY MEAL PROGRAMME ON THE NUTRITIONAL STATUS OF SCHOOL CHILDREN
TRANSSTELLAR JOURNALS, 2018
The Marijuana Ladder: Measuring motivation to change marijuana use in incarcerated adolescents
Drug and Alcohol Dependence, 2006
Alcohol Consumption Trajectory Patterns in Adult Women with HIV Infection
AIDS and Behavior, 2013
Wasteland Medicinal Plant Resources of Aligarh and Mathura
IOSR Journals , 2019
Decarbonization of the Cargo Shipping Fleet
Journal of ship production and design, 2022
Dynamic Growth Estimates of Maximum Vorticity for 3D Incompressible Euler Equations and the SQG Model
arXiv (Cornell University), 2010
Preliminary results on the electrostatic double-layer force between two surfaces with high surface potentials
Colloids and Surfaces A: Physicochemical and Engineering Aspects, 1998
Immersion based observer for the switched reluctance motor
IFAC-PapersOnLine, 2020
Inhibitory effect of sodium metabisulphite and chlorine on growth of Aspergillus spp. and Penicillium spp. strains isolated from marine shrimp
Ciência Rural, 2013
Isolation of a Nodulisporium Species from a Case of Cerebral Phaeohyphomycosis
Journal of Clinical Microbiology, 2001
Reduction of Abeta amyloid pathology in APPPS1 transgenic mice in the absence of gut microbiota
Scientific Reports, 2017